Research
Here is the list of the research projects I have been working on.
Line surveys in high-redshift dusty galaxies
Understanding the nature of the galaxies in the early Universe requires a full view of their interstellar medium by probing their molecular complexity. Therefore, we have conducted a series of line surveys with NOEMA and ALMA towards some of the brightest dusty galaxies at , including starburst-dominated galaxies as well as quasars: APM08279+5255, NCv1.143, G09v1.97, and BR1202-0725 (based two NOEMA proposals, PIs: Yang, Omont; and two ALMA proposals, PI: Yang).
By probing into such unprecedentedly rich details of their ISM, going beyond the CO lines, we are now able to utilize a toolset of molecular probes that can help us understand the properties of the ISM at high redshift at a level that has never been riched before. These molecular/atomic lines will eventually help us understand the star formation and AGN activity within these dusty galaxies at high redshifts, revealing their nature, origin, and fate.
SUNRISE is a line survey project targeting the rest-frame submillimeter (from ~ 300 GHz to THz) spectra of high-redshift dusty galaxies, based on observations of NOEMA and ALMA.
SUNRISE-1: NOEMA line surveys of APM08279+5255 and NCv1.143
The first result is now published on A&A by Yang et al. (2023). In this first-result paper, we report the NOEMA line survey in APM08279+5255 (a =3.9 gravitationally lensed dusty quasar) and NCv1.143 (a =3.6 lensed submillimeter galaxy). The following figure shows the spectra. We have detected many molecules for the first time at high redshifts, such as CH, CCH, c-CH, NH, HCN-VIB, and CS.
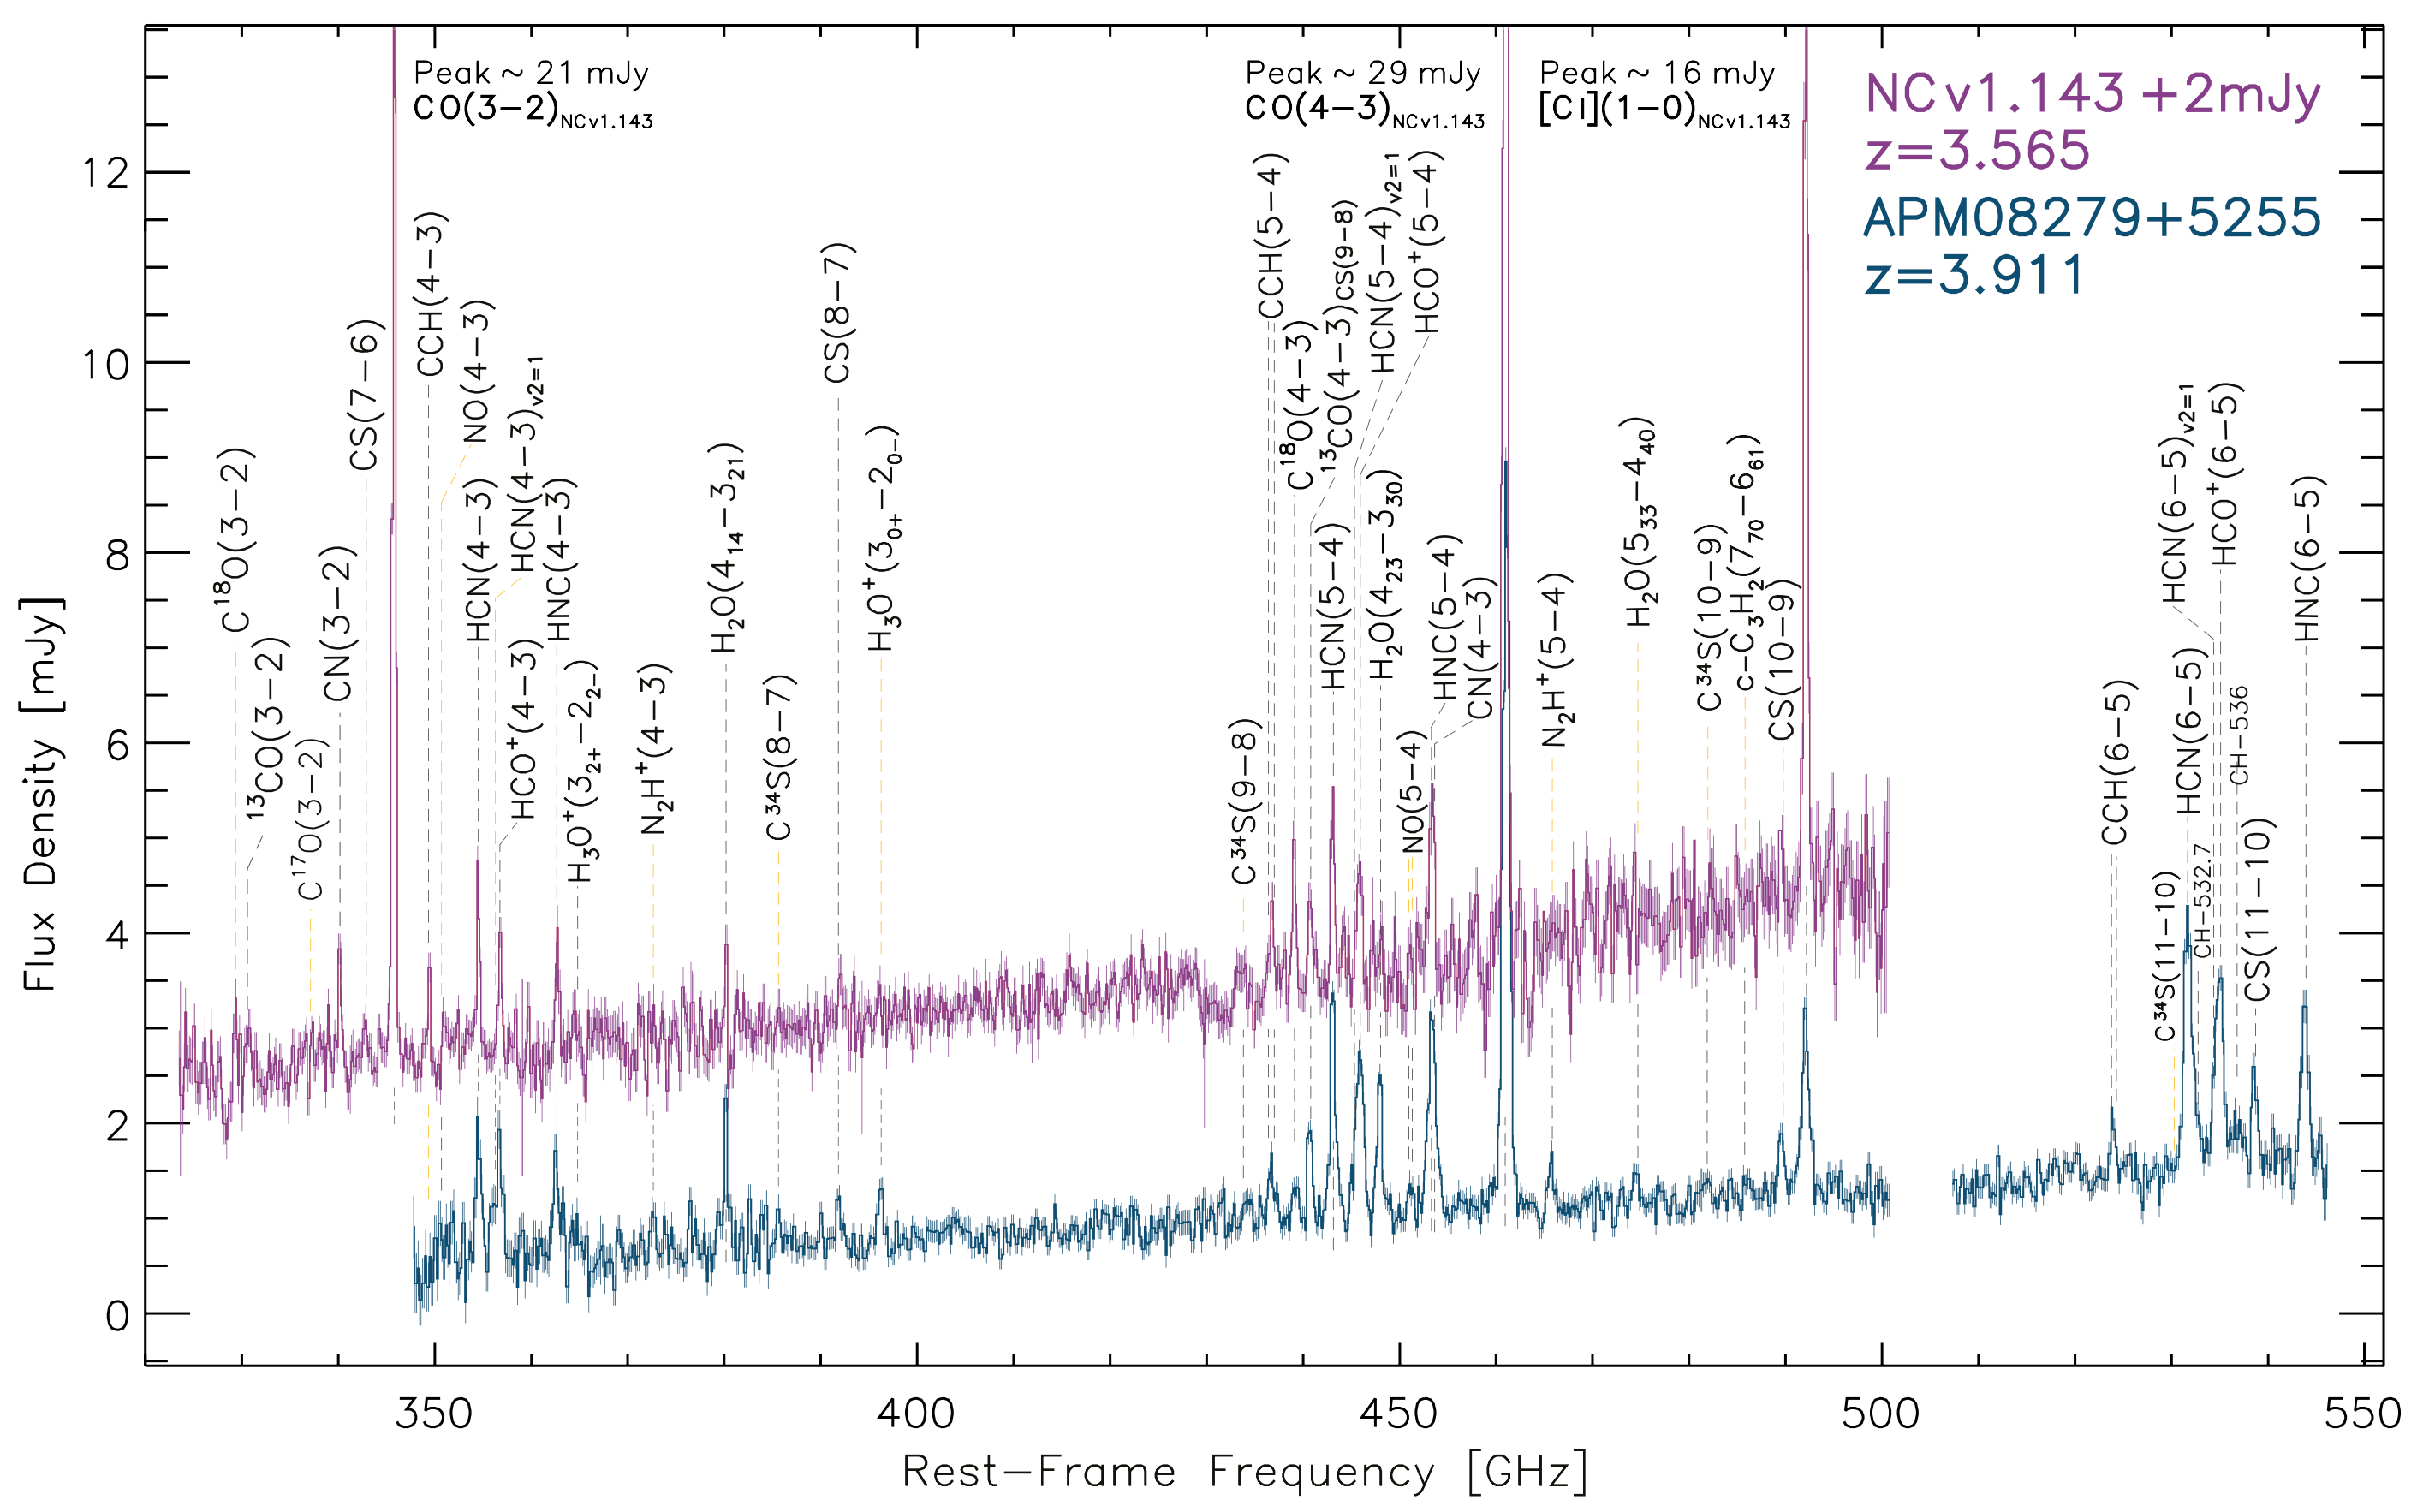
SUNRISE spectra of APM08279+5255 and NCv1.143 from the NOEMA observations. See details in Yang et al. (2023).
Here, we show the line luminosities of all the molecules detected so far in these two galaxies below, all from our SUNRISE line survey except for the CO lines. These "ladders" of the molecules show us how excited each of the molecules is, and we will be able to extract the physical conditions of the ISM by analyzing these "ladders."
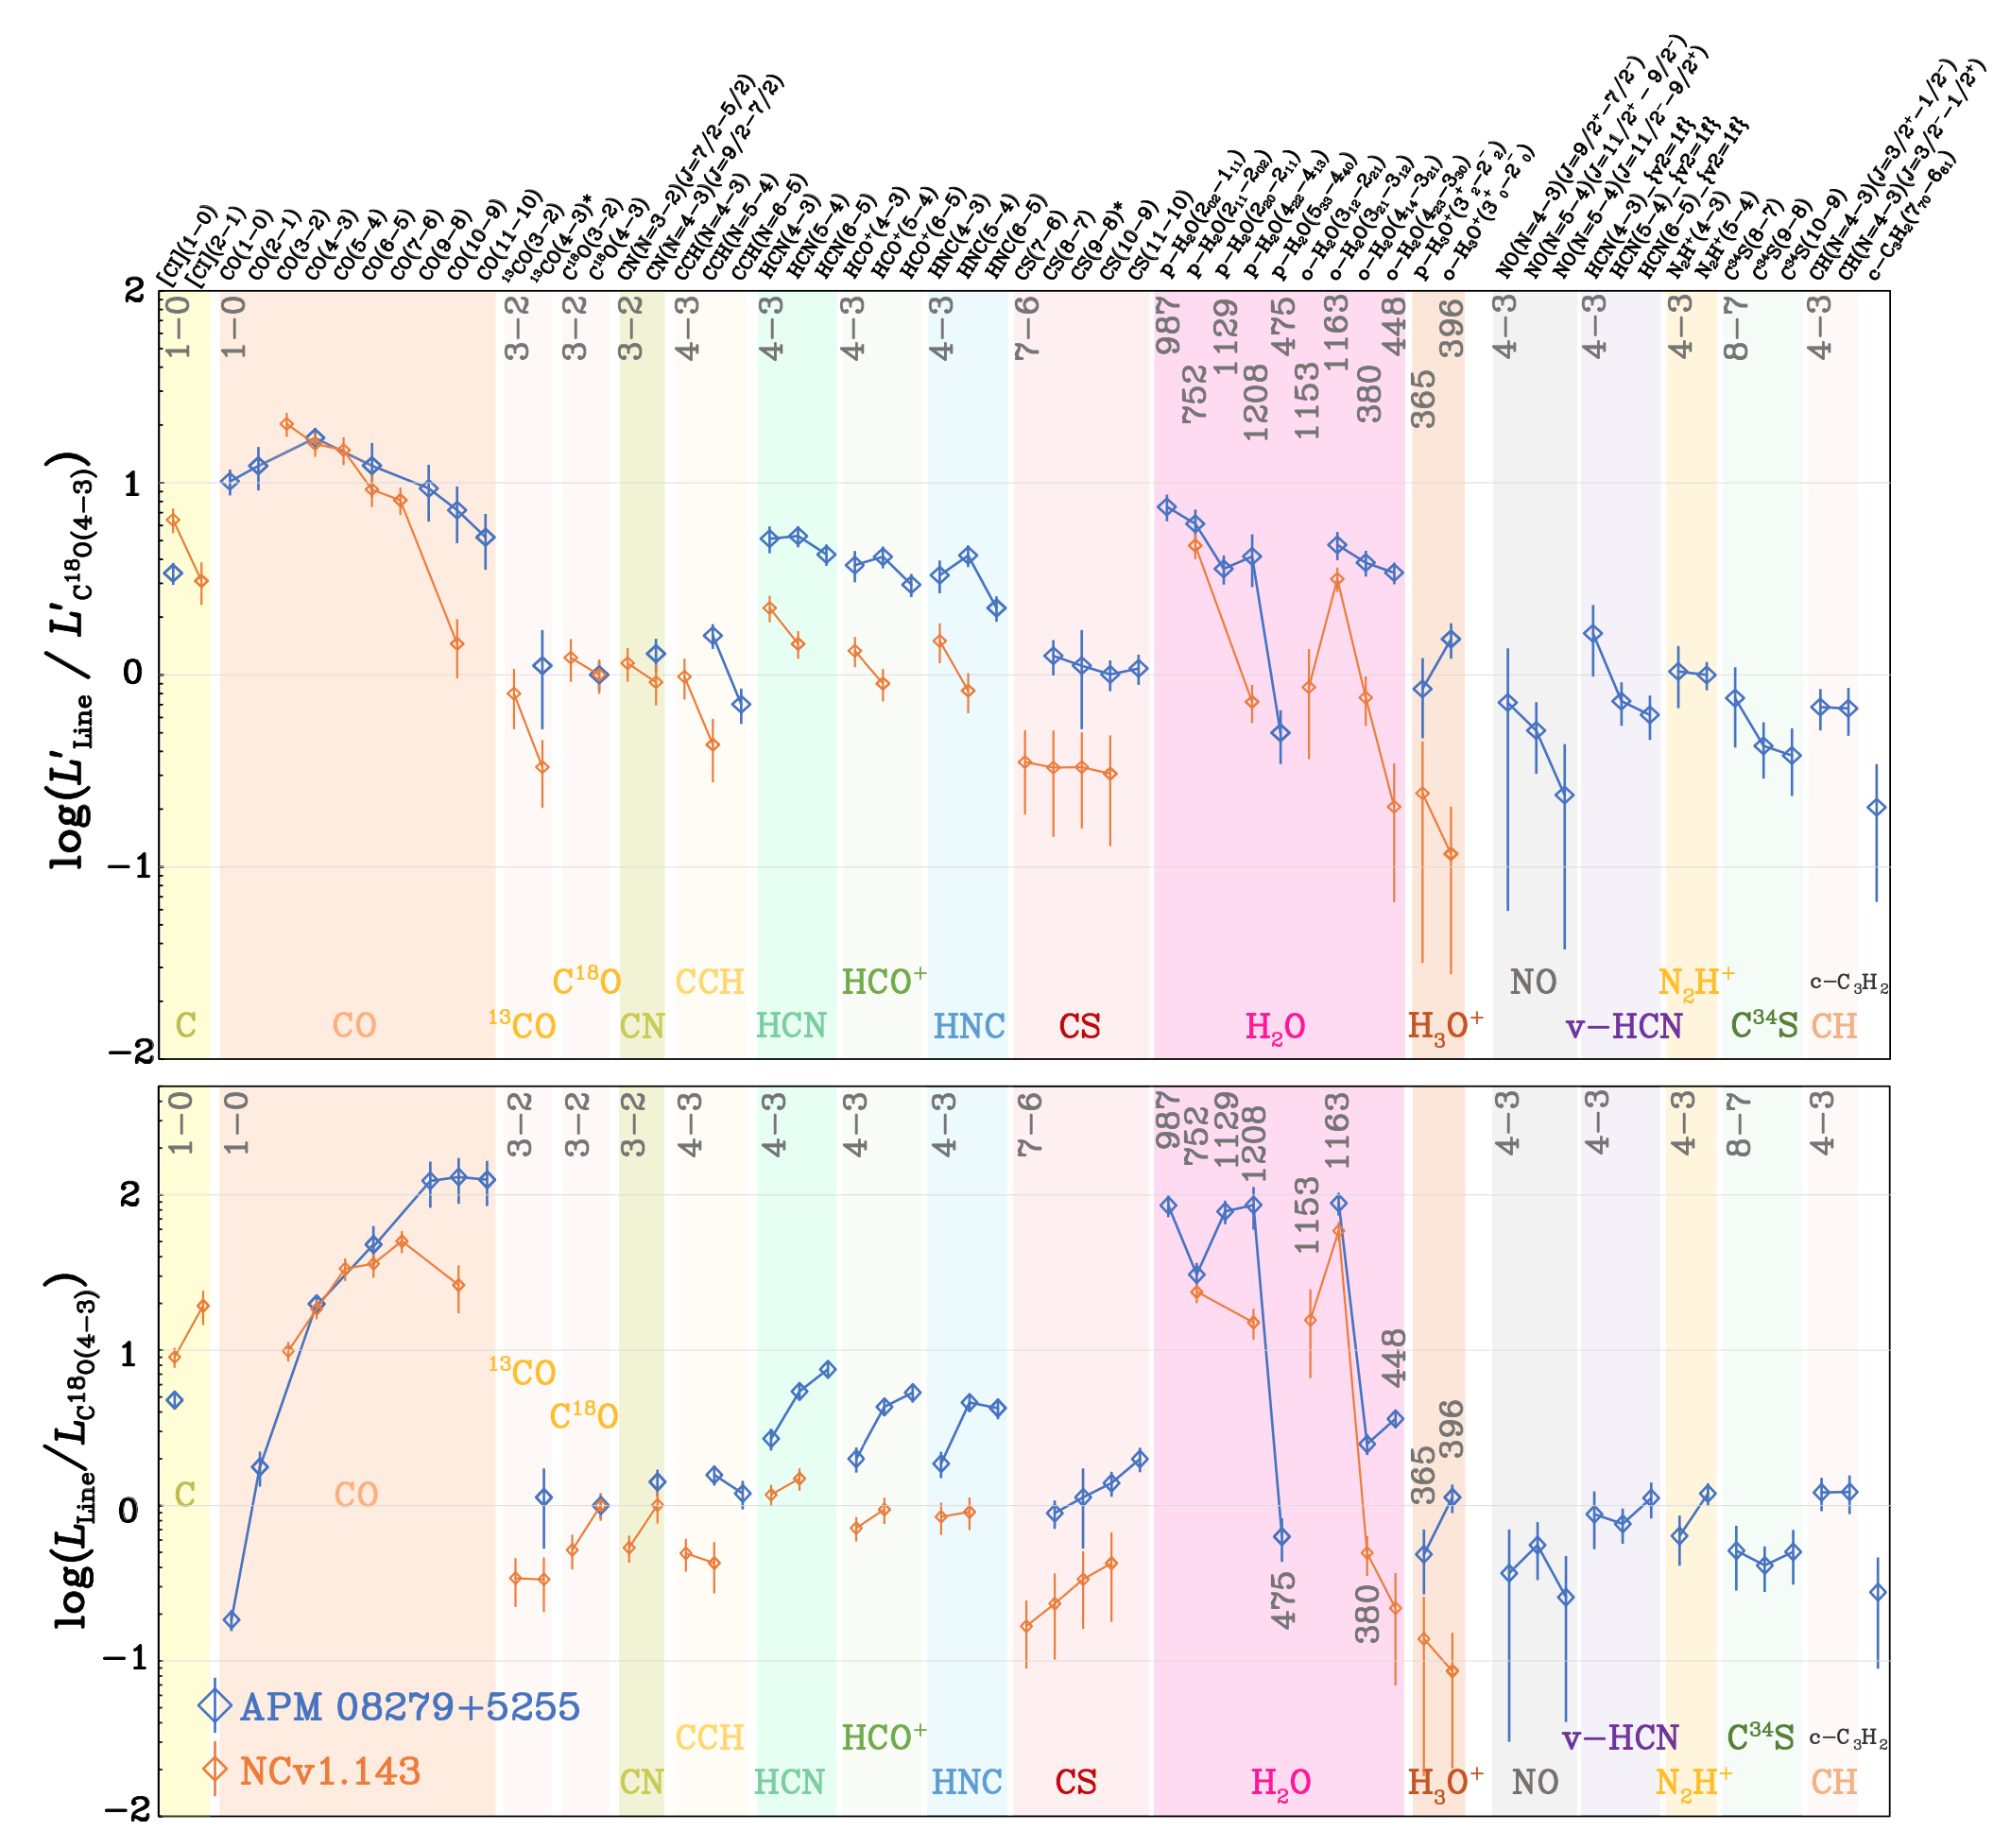
Spectral line energy distributions (so-called SLEDs) of all the molecules detected in APM08279+5255 and NCv1.143 from SUNRISE. See details in Yang et al. (2023).
SUNRISE-2: ALMA line surveys of BR1202-0725
Ongoing project.
SUNRISE-3: ALMA line surveys of G09v1.97
Ongoing project.
HO in galaxies near and far
Water is one of the most important molecules in the Universe. In the gas phase interstellar medium (ISM), after molecular hydrogen, HO is commonly the most abundant molecule together with CO in the ISM of galaxies. While it remains mostly locked up in icy grains (in solid phase) in the cold molecular ISM, it can be desorbed into gas phases in certain conditions (see, e.g., van Dishoeck et al. 2013). Unlike CO, HO can be excited via both collisions and by absorbing far-infrared photons (far-infrared pumping). The far-IR pumping mechanism makes HO line unique probes compared to standard gas tracers like the CO line, e.g., HO tells us not only about the gas conditions but most importantly about the physical conditions of the far-IR radiation field such as the dust temperature, optical depth and its physical size. Besides, HO traces various a variety of physical processes such as shocks and gas outflowing.
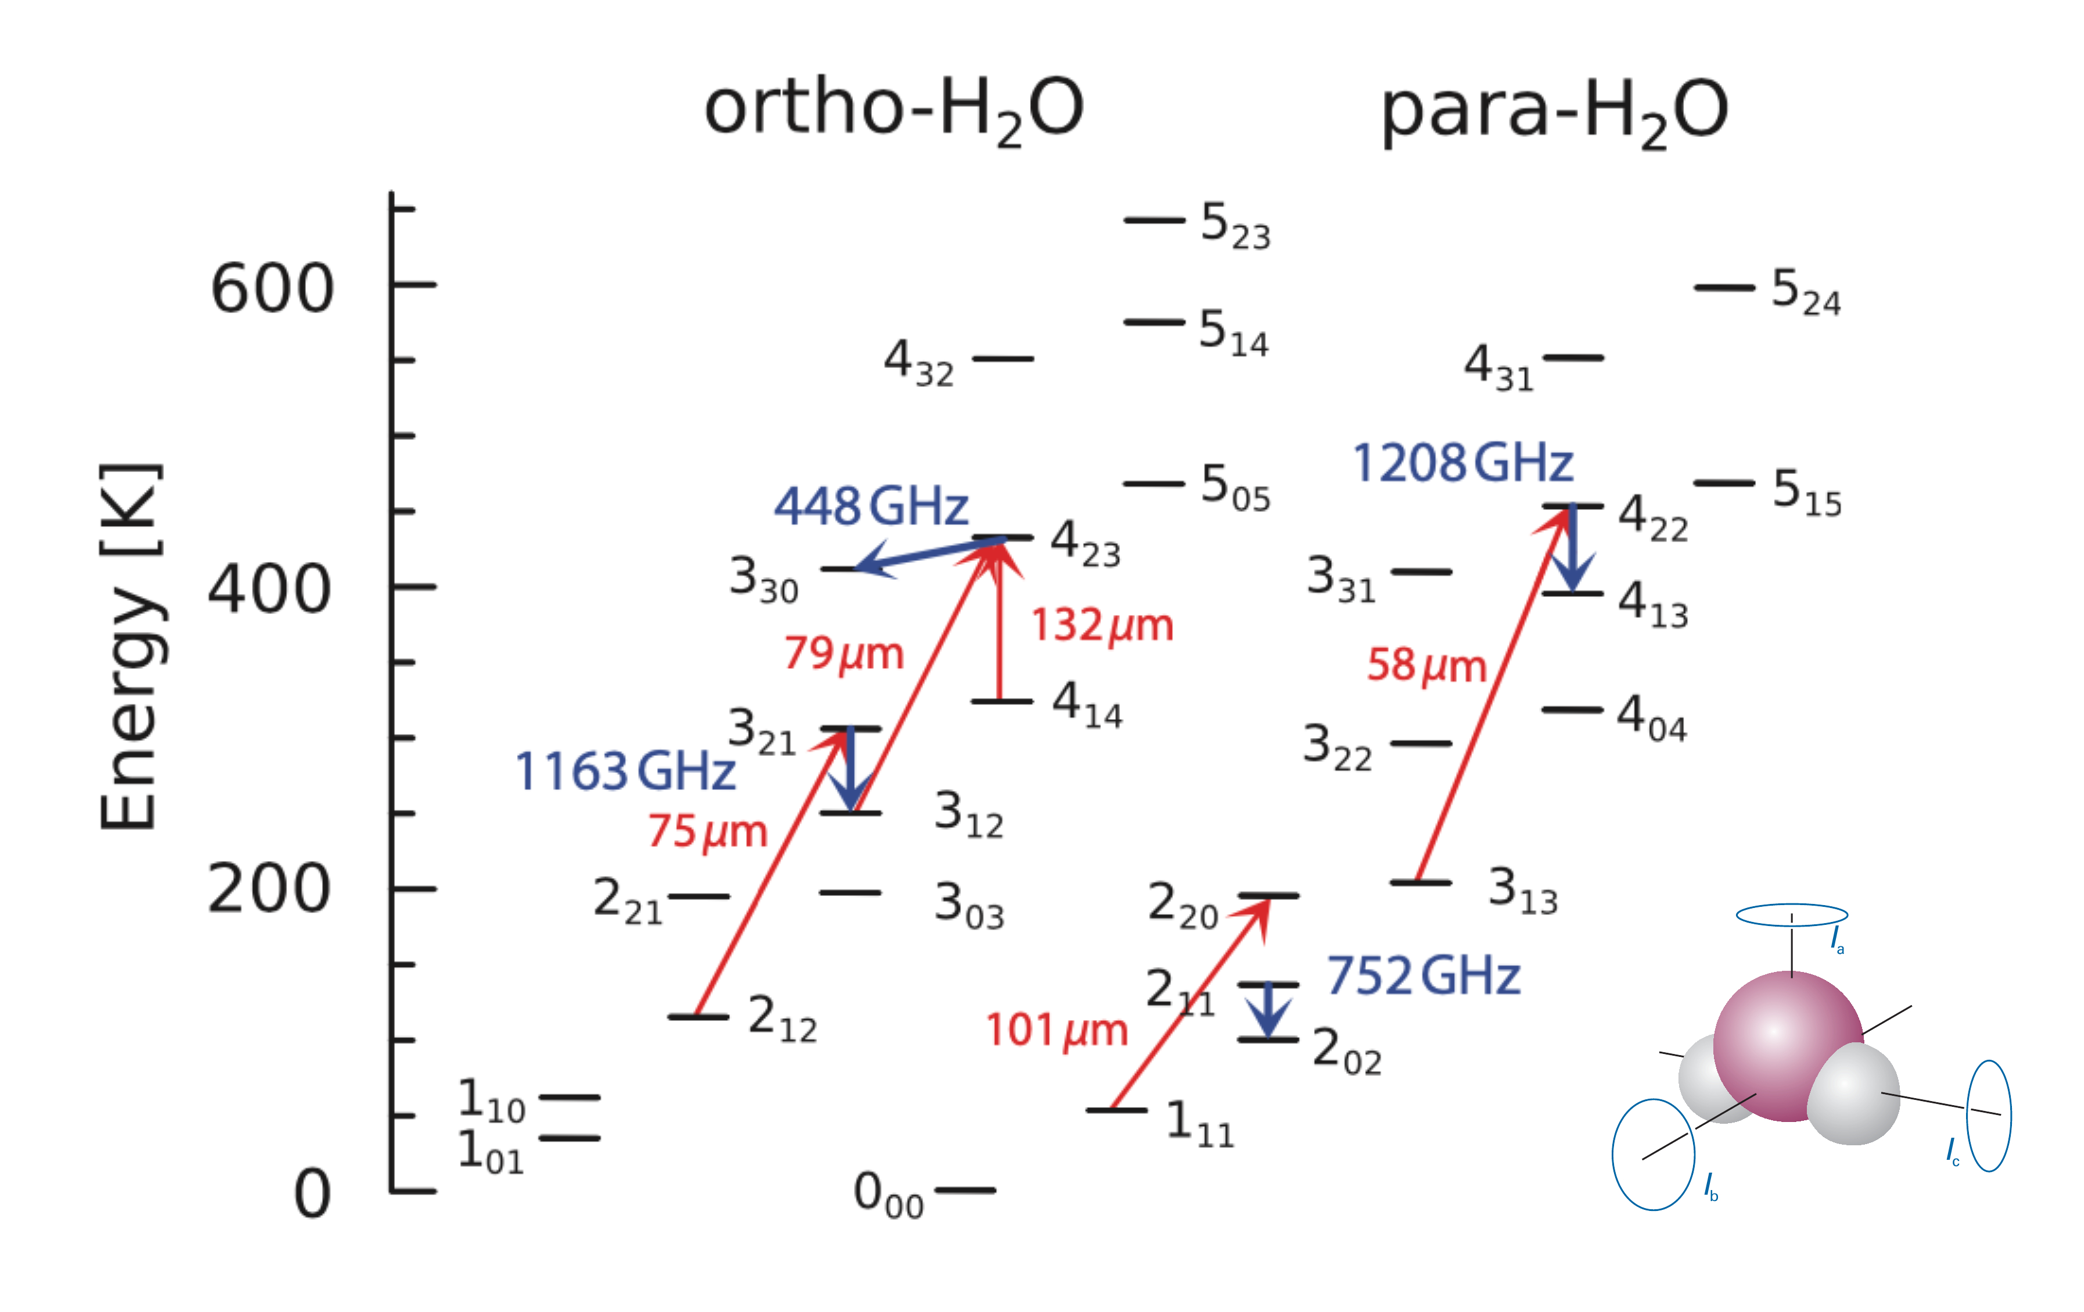
Figure adapted from Yang et al. (2020), which shows the rotational energy levels of the water molecule and the frequencies of the corresponding emission.
The first large-sample water line survey in nearby galaxies
Because of the atmosphere, it is nearly impossible to observe HO coming from the nearby Universe from the ground. Therefore, space telescopes/observatories like ISO, SWAS, Odin, Spitzer, and Herschel are used in studies of HO.
We have conducted a study of the extragalactic HO lines among 176 galaxies (the largest sample for the first of its kind) observed by Herschel SPIRE (Yang et al. 2013). The submillimeter HO lines are found to be the second brightest molecular emitters after CO. The luminosity of the HO lines () is close to being linearly correlated with infrared luminosity (), being consistent with the model that far-infrared (far-IR) pumping is dominating the HO line excitation.
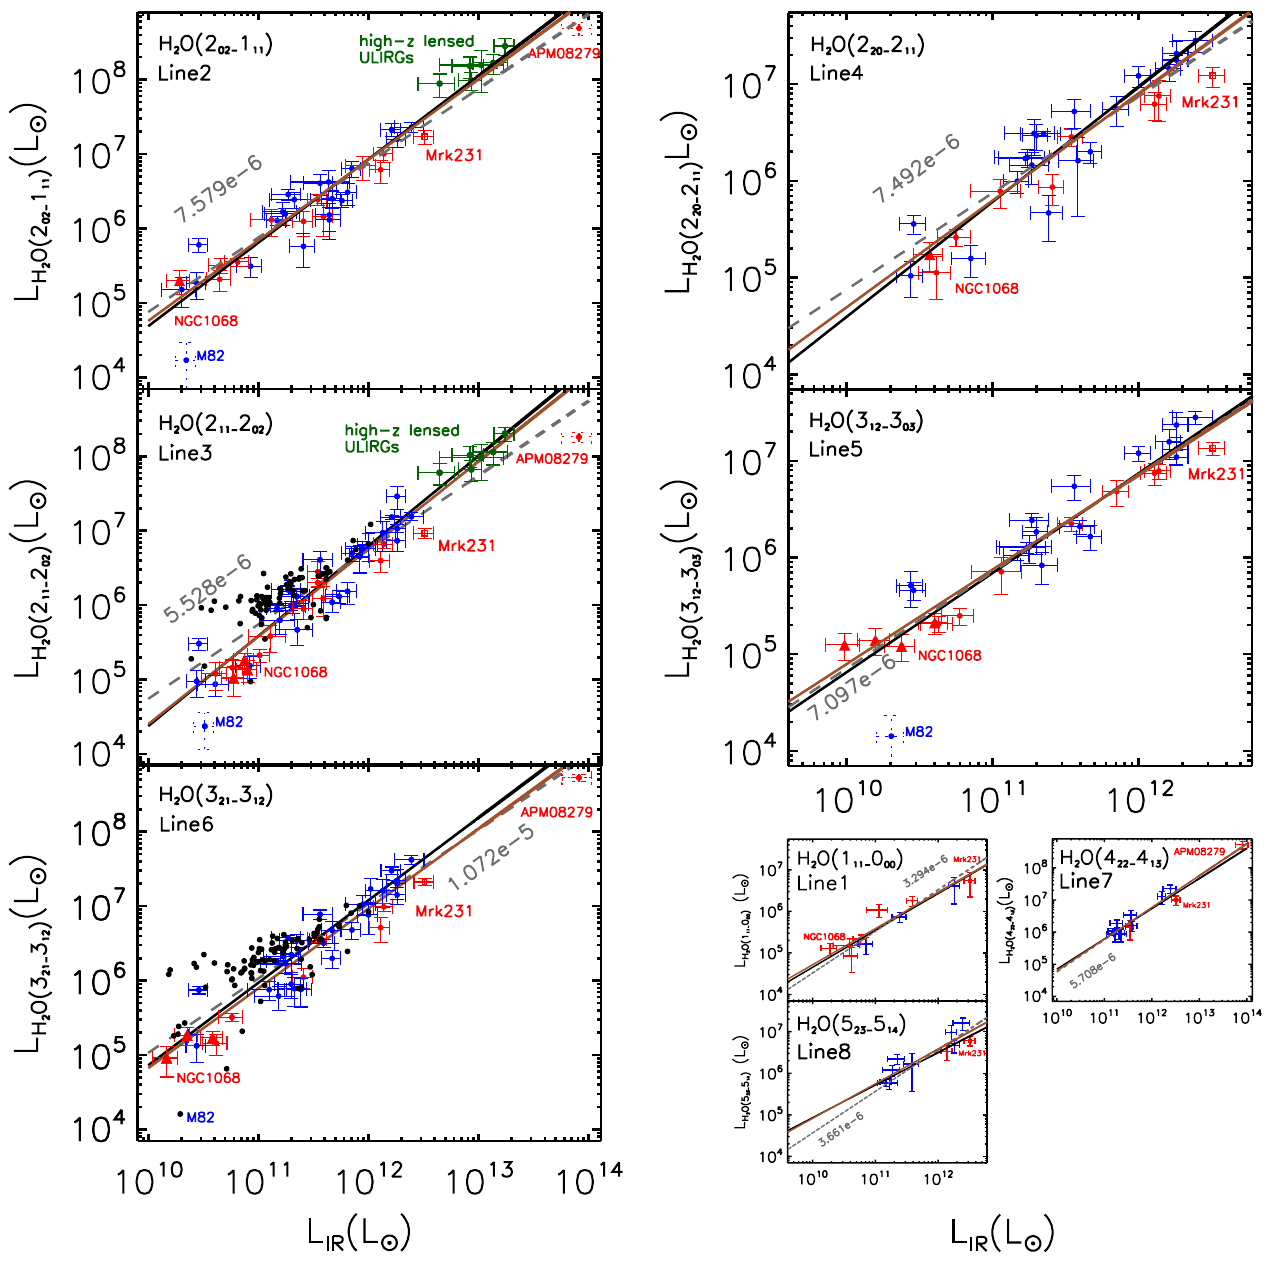
Figure adapted from Yang et al. (2013), which shows the tight correlations between the submillimeter H2O line and total infrared luminosities (integrated from 8 to 1000 micron).
We can also have a look at the excitation of HO lines for the large sample by checking the spectral line energy distribution (SLED). The first peak (2-1) contains a mixed contribution from collisional excitation and far-infrared pumping, while the second (3-3) is dominated by far-infrared pumping.
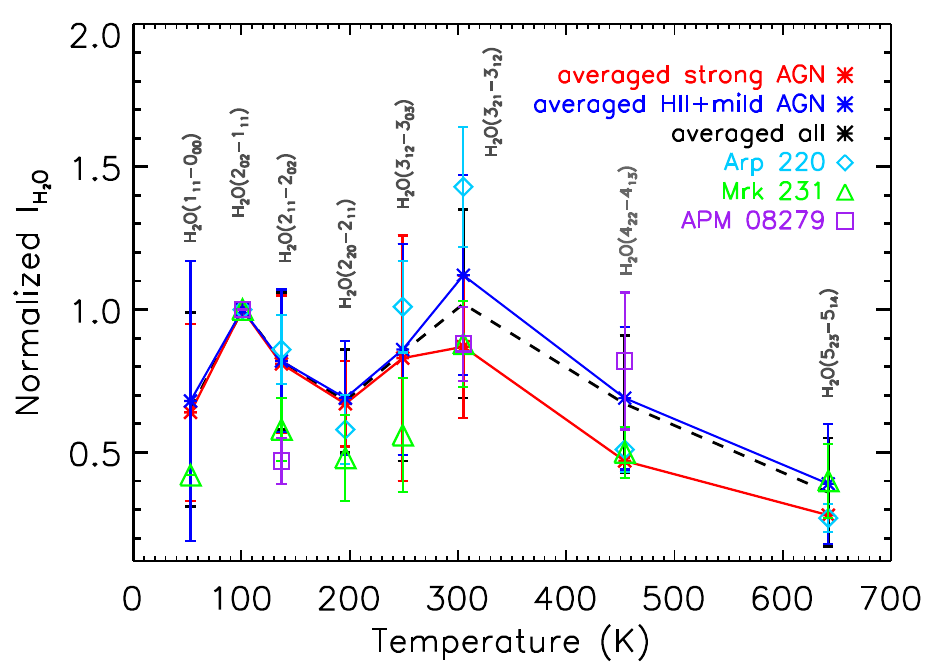
Figure adapted from Yang et al. (2013), which shows the normalized (by the flux of the 202-111 line) SLED of submm H2O lines show two peaks at low- and high-lying transitions, respectively.
You may also be interested to read more from our IAUGA poster
Here are some useful tables related to the paper
Information on the samples in the paper: Download Table here.
The HO line and the beam-matched IR luminosities: Download Table here.
HO in high-redshift dusty star-forming galaxies
At high redshift, because the submillimeter HO lines have been shifted to lower frequencies, we can observe some of the HO lines directly using ground-based telescopes like NOEMA and ALMA.
Spatially integrated studies
We have firstly selected a group of strongly lensed dusty star-forming galaxies from the Herschel-ATLAS survey and successfully detect HO lines (2-1 and 2-2) in seven submillimeter galaxies (Omont, Yang et al. 2013), with NOEMA low spatial resolution configurations. We have thus studied the global properties of the HO lines. The results confirm that HO lines are among the strongest molecular lines in high-redshift dusty star-forming galaxies. In this sample, we also find a similar tight correction between and , which confirms the far-infrared pumping dominance.
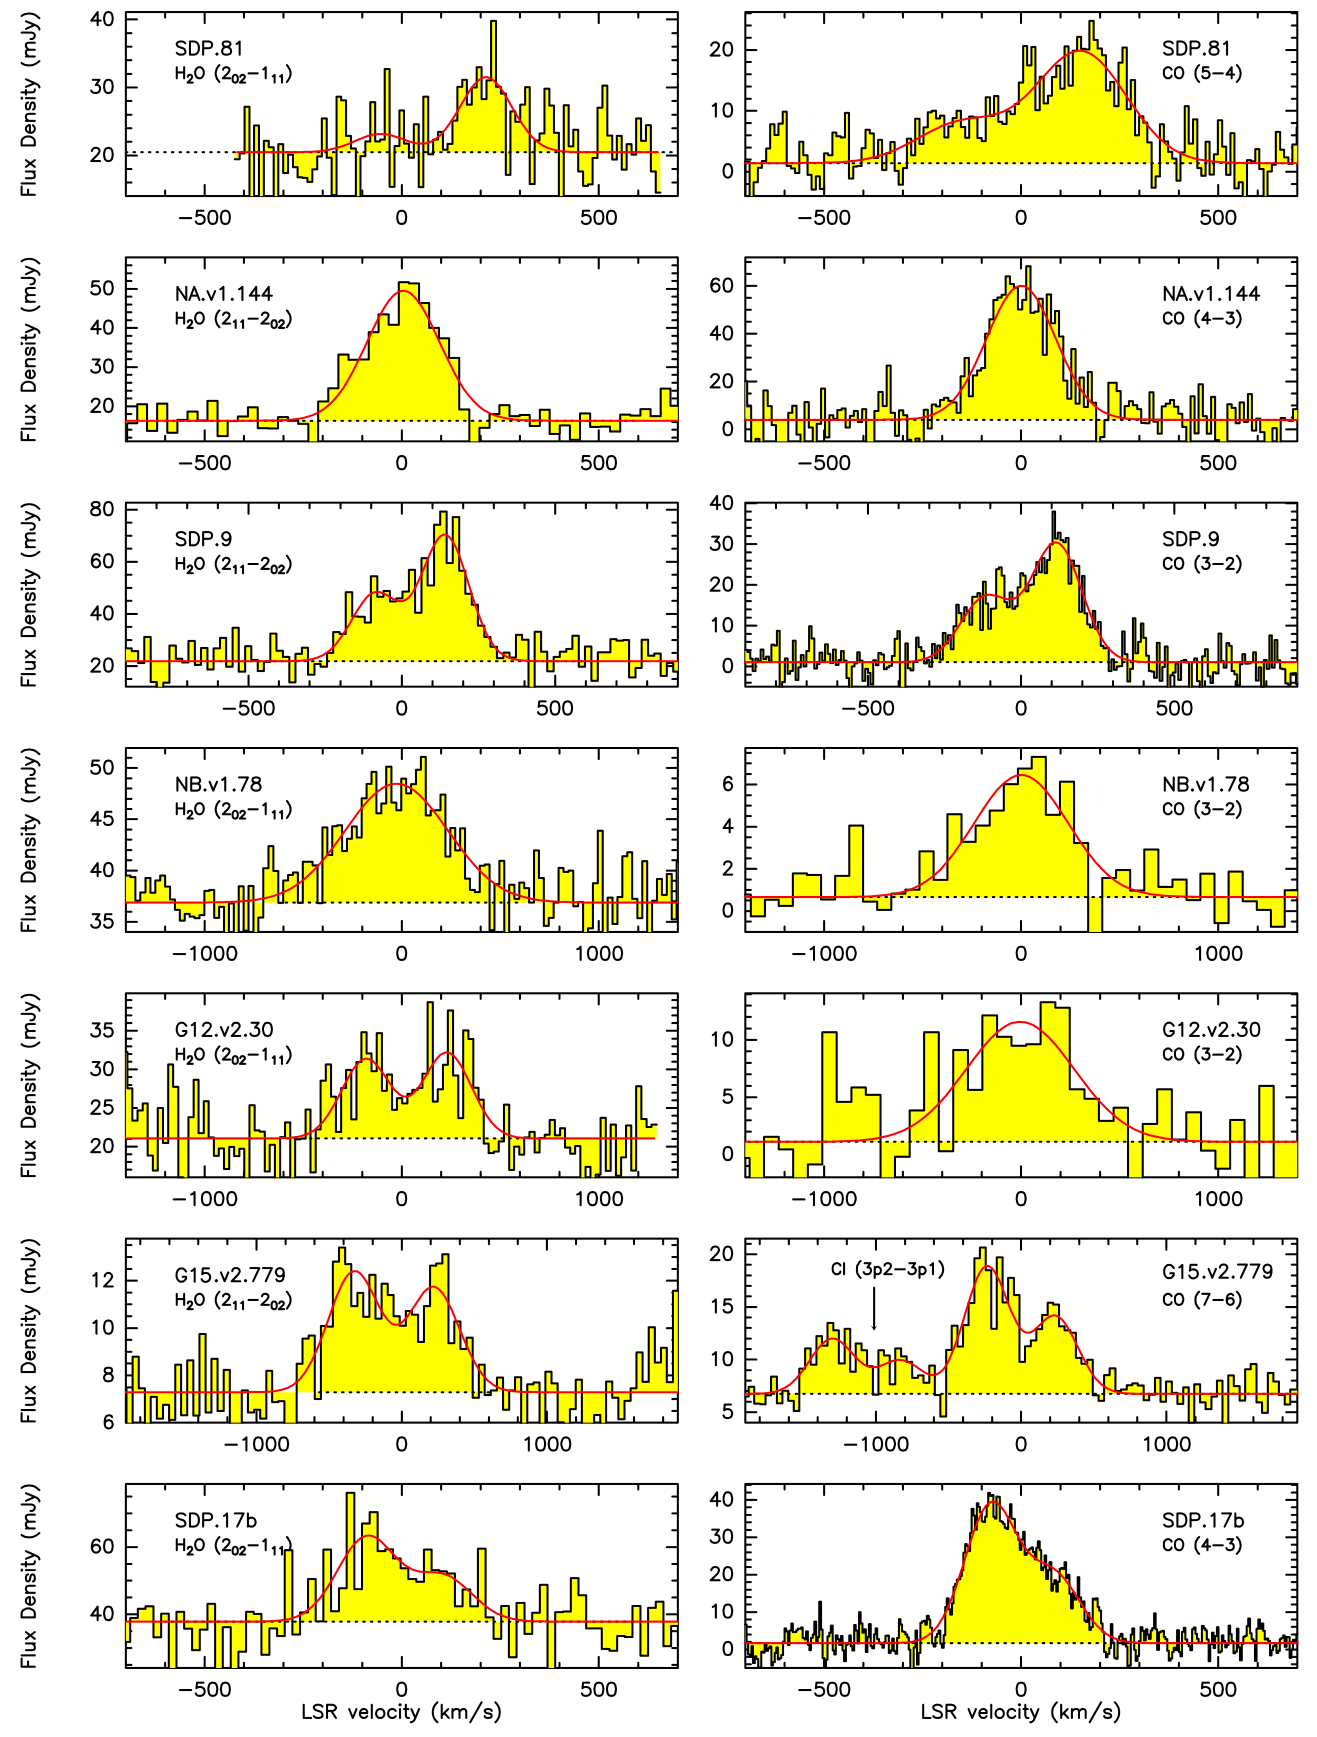
Figure adapted from Omont et al. (2013), which shows striking similarities between the profiles of the H2O and CO lines.
Following our initial study, we have further expanded the sample (adding 11 more galaxies at ) and the transitions of the HO lines (both = 2 and 3) and included HO lines as well (Yang et al. 2016). This is the largest sample study of the HO and HO lines at high redshift.
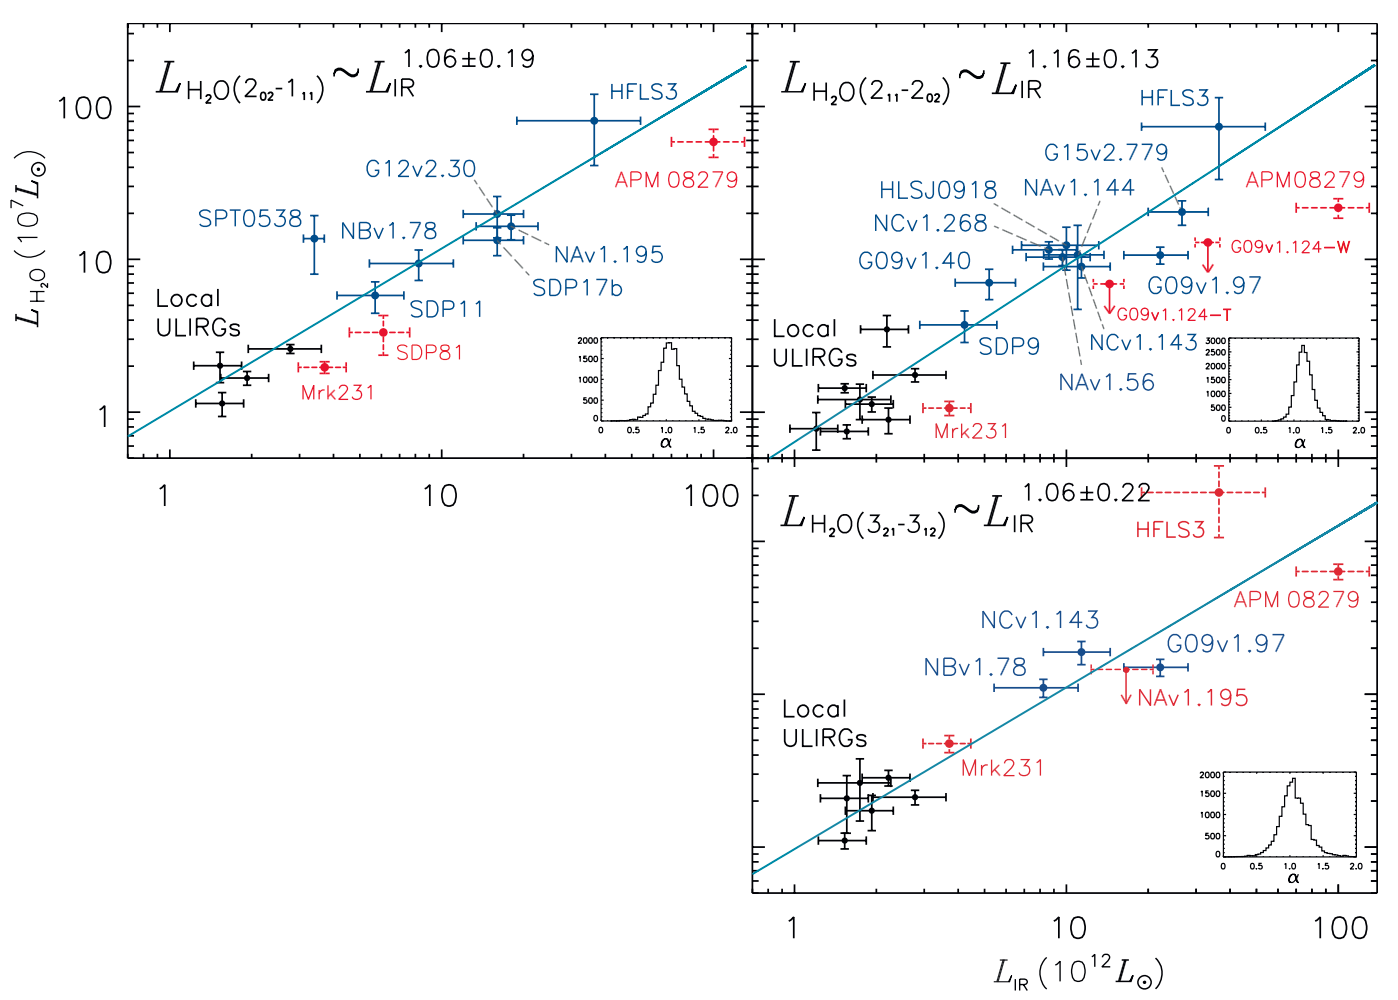
Figure adapted from Yang et al. (2016), shows the correlation between infrared and water line luminosities in local and high-redshift dusty star-forming galaxies. The black points represent the local sample from Yang et al. (2013). The blue points with solid error bars are from this work. The light blue lines show the fitted line with slopes indicated per subfigure.
In this study, we confirmed the tight linear correlation at high redshift with a larger sample. And most importantly, we explored the excitation of HO lines for five of the galaxies which have both = 2 and 3 HO lines detected.
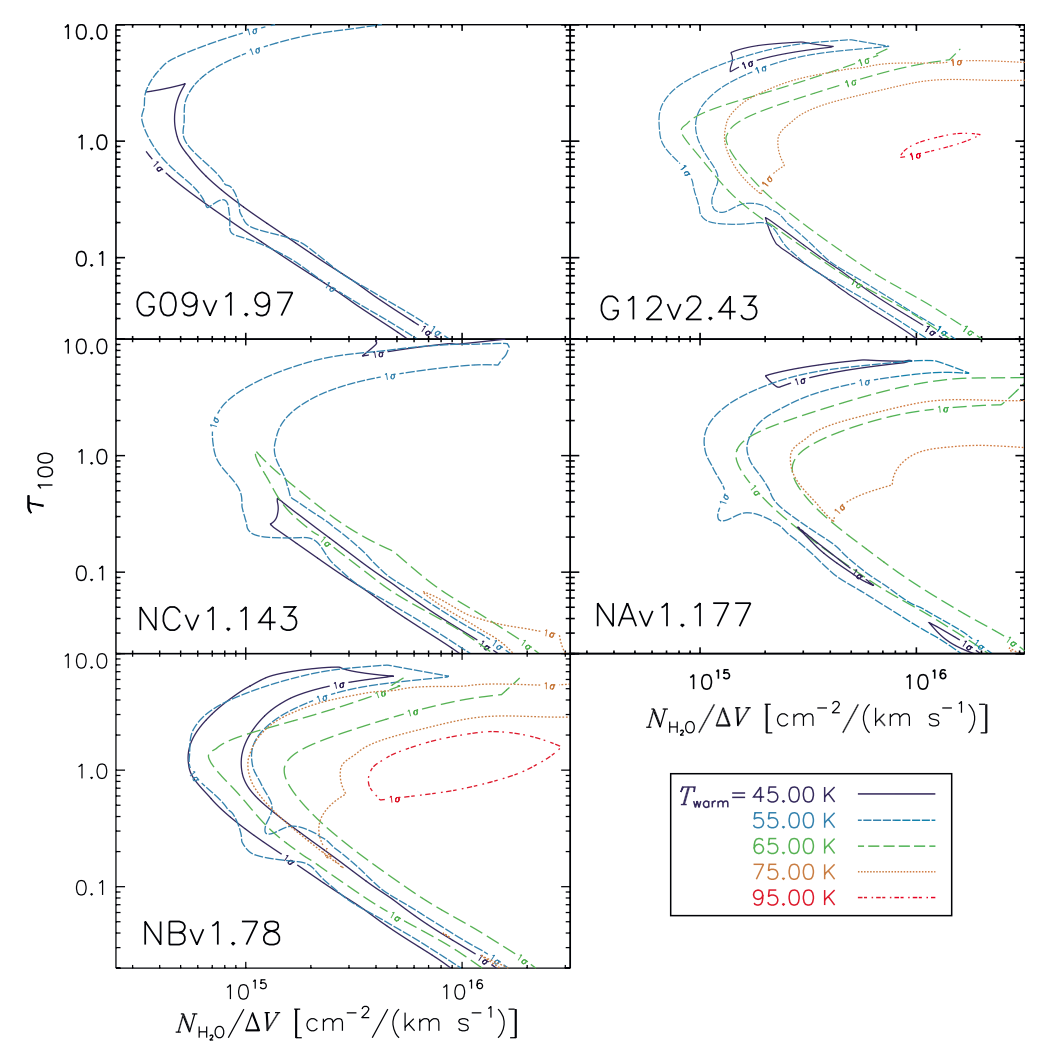
Figure adapted from Yang et al. (2016), showing the parameter space of the water excitation model. ±1σ contours are shown for each plot. Different colors with different line styles represent different temperature components of the warm dust, as shown in the legend. The explored warm dust temperature range is from 35 K to 115 K. The temperature contours that are unable to fit the data are not shown in this figure. From the figure, we are able to constrain the dust optical depth, dust temperature, and water column density. However, there are strong degeneracies. Thus, we need additional information, such as the velocity-integrated flux densities of J ≥ 4 H2O lines, to better constrain the physical parameters.
Besides, we also discovered a very tight linear correlation between the line luminosity of HO and HO. Since HO is an intermediate in the chains of reactions among O, H, H, e, cosmic rays, and H. HO lines can offer information regarding the ionization states of the ISM. We find a tight correlation between HO and HO, and the ratio of HO/HO is about 3, suggesting a high cosmic-ray ionization rate rate of 10 s to 10 s.
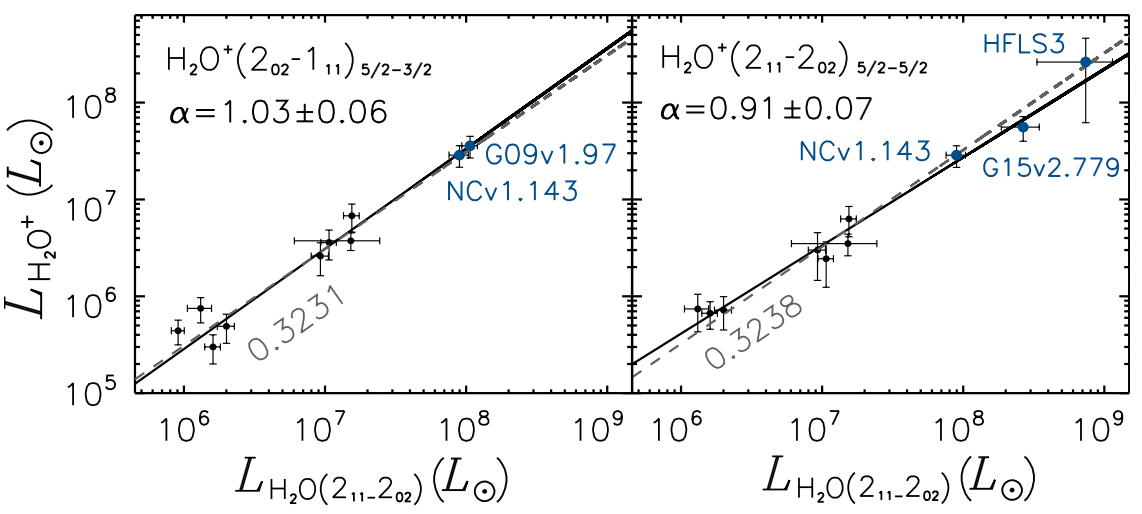
Figure adapted from Yang et al. (2016), which shows the correlation between the luminosity of J = 2 ortho-H2O+ and para-H2O(211–202). We found a linear correlation between LH2O+ and LH2O. Black points are from Yang et al. (2013). Dark blue ones are from this work. Such a tight correlation indicates the ionization conditions are similar among the galaxies.
You may also be interested to read more from my talk presentation at the conference "Water in the Universe: From Clouds to Oceans", @ESA/ESTEC (Noordwijk, Netherlands, 2016).
Resolving the structure with ALMA
Taking advantage of the strong lensing effect (which increases the spatial resolution), we have observed one of the brightest lensed galaxies with ALMA (Yang et al. 2019). We have obtained high-spatial-resolution maps of CO, HO, and HO in a strongly lensed dusty star-forming galaxy at . For the first time, we studied the spatial distribution of HO emission at sub-kpc scales in the source plane and found that the emission of CO, HO, and HO are coincident.
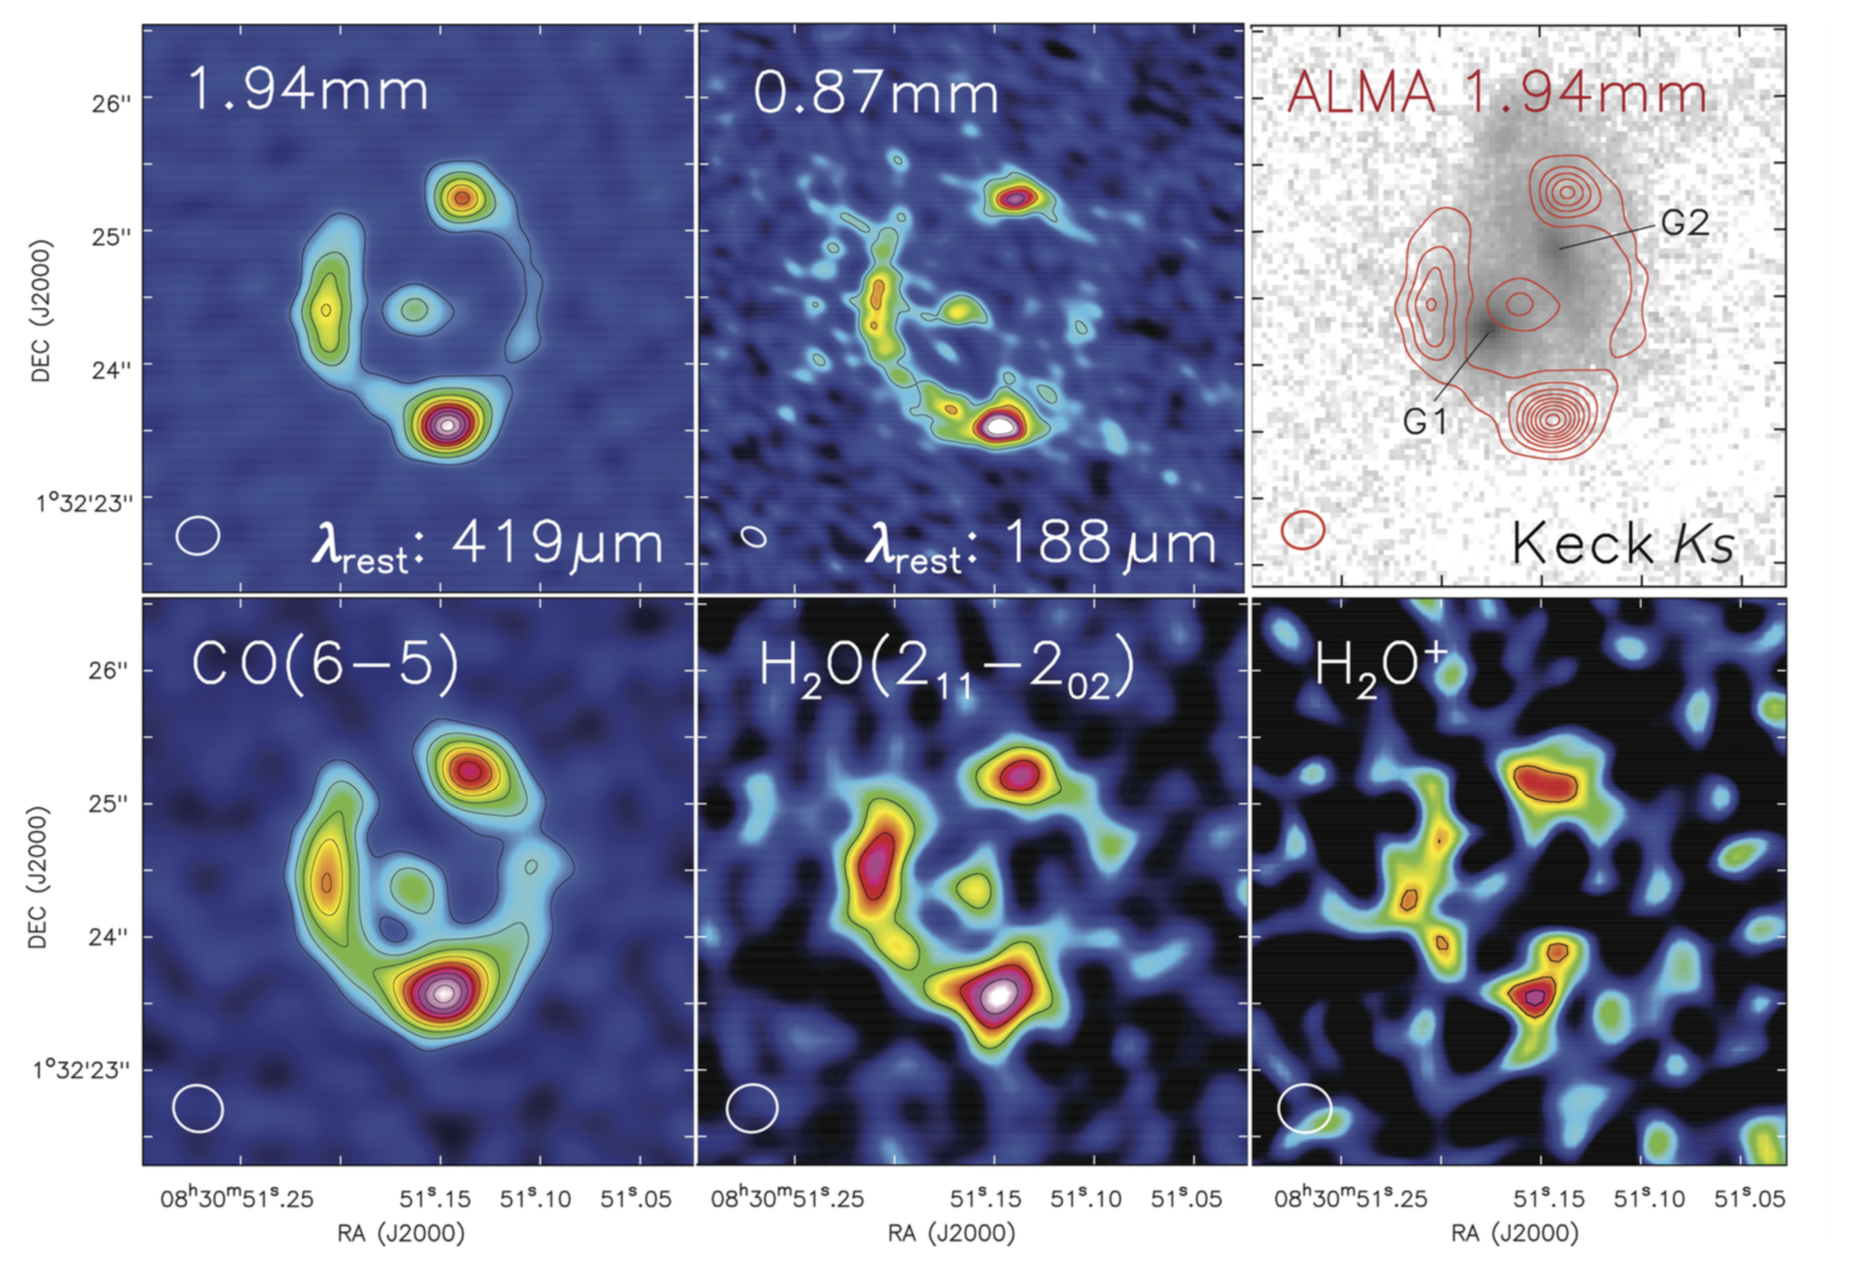
Figure adapted from Yang et al. (2019), which shows the ALMA images of dust continuum and CO, H2O, H2O+ line in G09v1.97, the resolution is about 0.2-0.4 arcsec. The third image of the first row shows the foreground galaxies, which are at redshift 0.626 (G1) and 1.002 (G2). No emission from G1 and G2 is detected in ALMA.
We have also obtained kinematic information from CO and HO emission. They turn out to be quite similar, which further indicates that the CO(6-5) line and the HO(2-2) lines are tracing the gas with similar conditions. This is the first time we see a resolved kinematic structure from HO emission in any extragalactic sources.
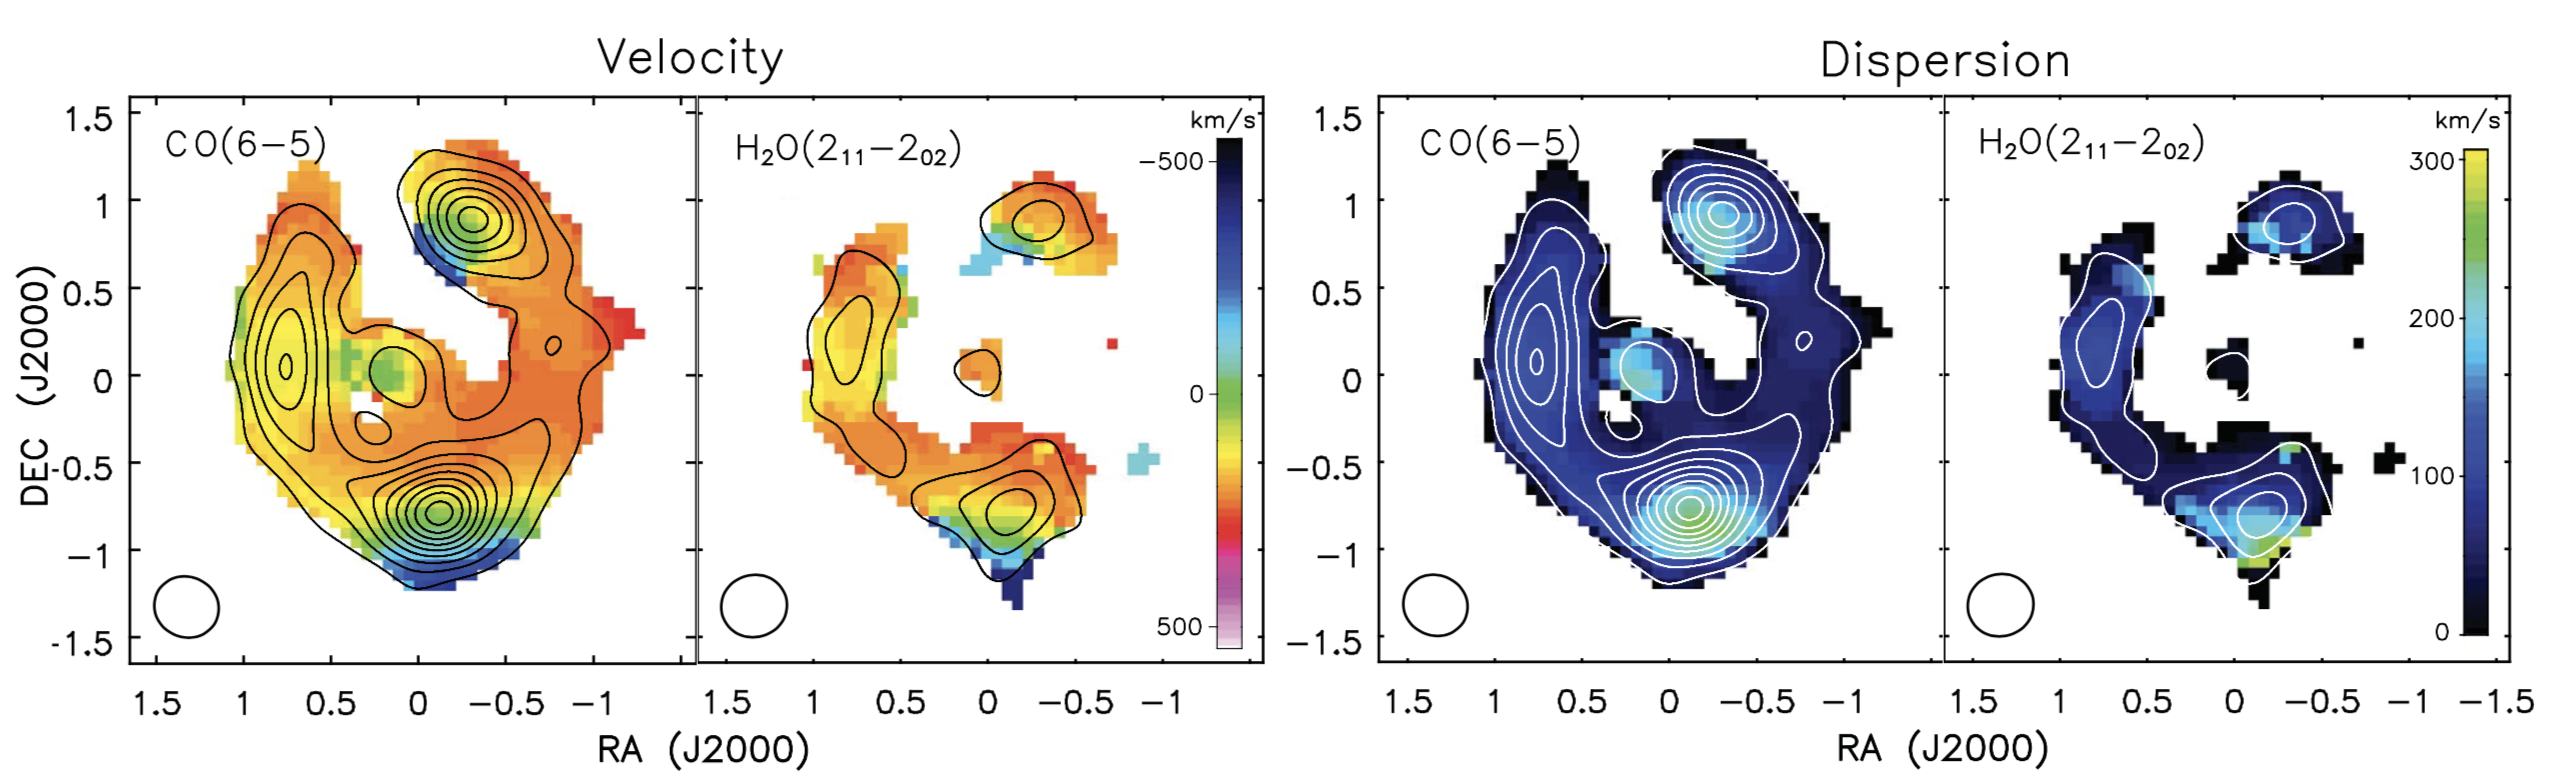
Figure adapted from Yang et al. (2019), which shows the velocity gradient and dispersion of the CO and water emission lines. As a comparison, their velocity characteristics are similar.
To reconstruct the intrinsic image of the galaxy, we use the lens modeling methods developed by Gavazzi et al. (2011), with an MCMC approach, we rebuild the images in the source plane. The source turns out to be a very compact, gas-rich major merger. While the cold dust emission is peaking in between two galaxies, in the interacting front, the CO and HO gas emission are peaking at the centers of each galaxy. This galaxy is a high redshift analog, yet much more dusty, and has a much higher star formation rate than the Antennae galaxies.
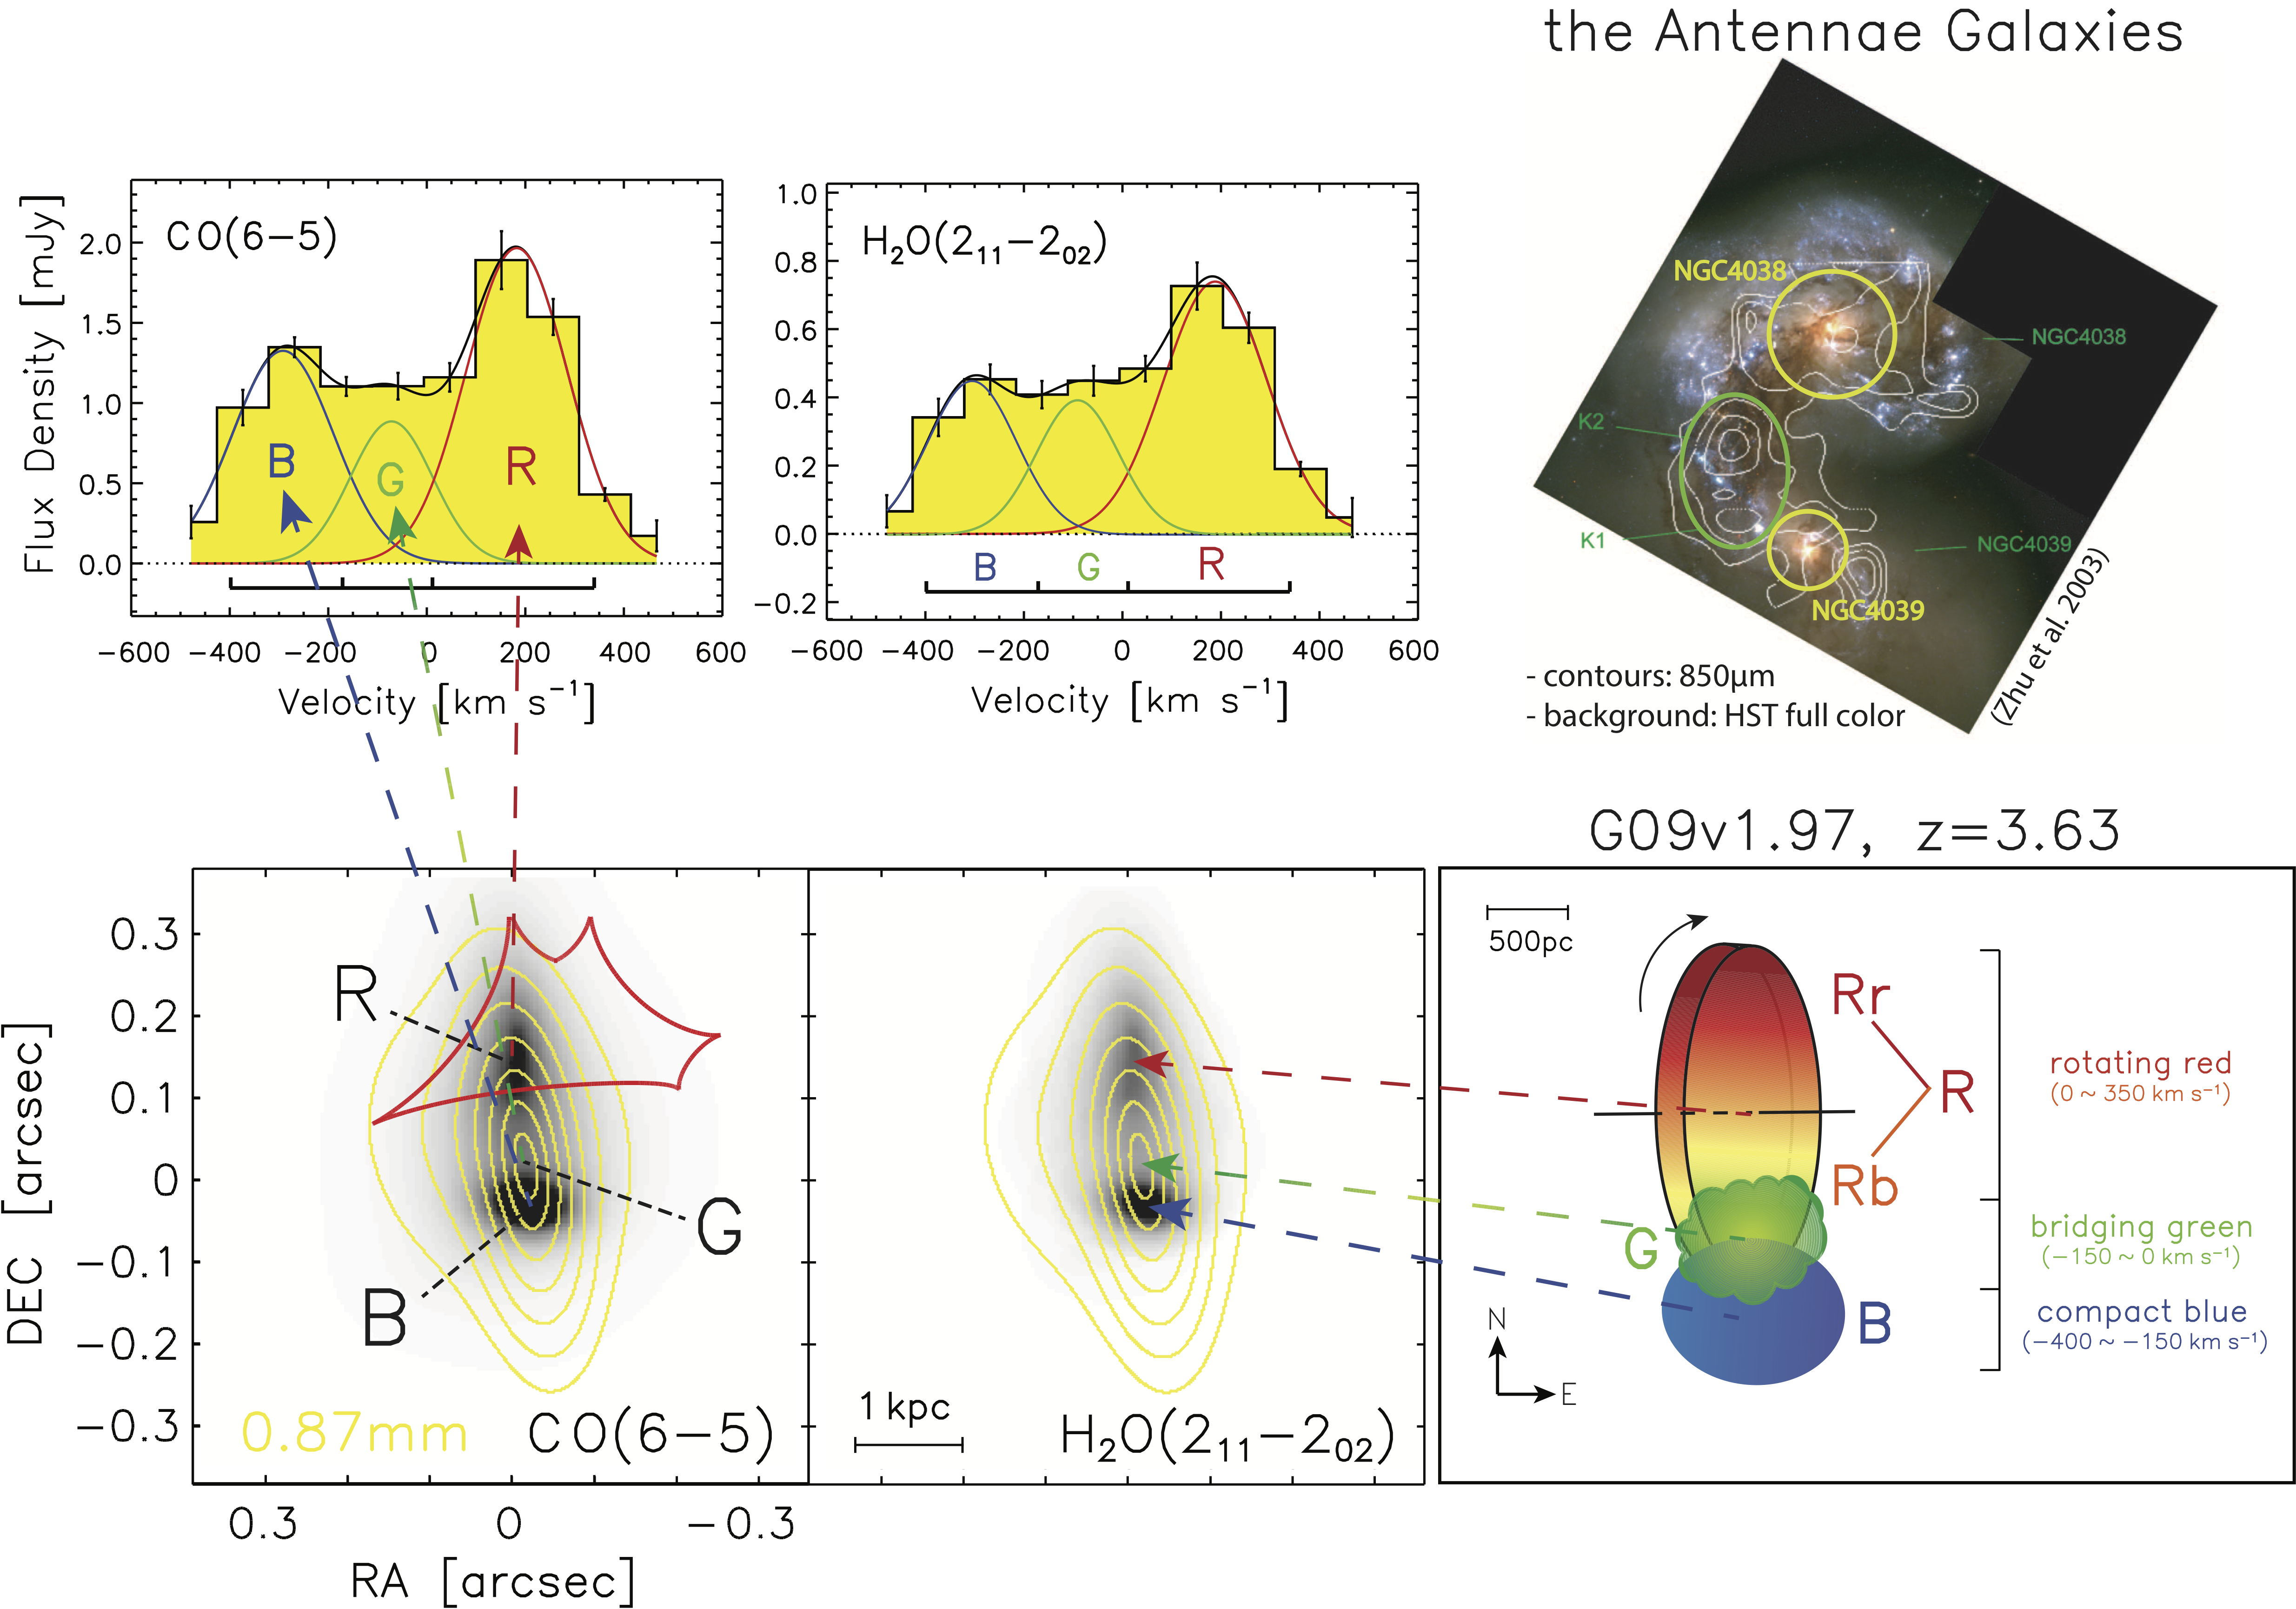
The two spectra in the upper left panels show the spatially integrated spectra of CO and water in the source plane (i.e., intrinsic). Below is the lens-model-reconstructed image of the velocity-integrated map of CO and water (background) overlaid with dust emission (yellow contour). On the right side, the upper image is the prototype galaxy merging system -- the Antennae Galaxies, while the lower panel displays the sketch of the G09v1.97, showing three velocity components from the northern redshifted rotating disk "R", the southern blue-shifted compact galaxy "B", and the bridging gas "G".
Study the ISM structure with HO lines
Water lines are unique probes of the ISM conditions. In some cases, we can infer the structures of the ISM from spatially integrated observations (without any resolved maps) of multiple transitions of the HO lines.
Recently, we have detected the 448 GHz HO(4-3) at high redshift for the first time (Yang et al. 2020), following the first detection in space by Pereira-Santaella et al. (2017) in ESO 320-G030. This 448 GHz transition is especially interesting because it can probe the deeply buried galaxy nuclei since the line requires high far-infrared optical depths to be excited. Using four water lines in total and the far-infrared/submillimeter/millimeter photometric data, we build a radiative transfer model that resolves the structure of the dusty ISM in the galaxy, which is composited of an optically thin 1 kpc disk with moderate dust temperature of 50 K and a very compact optically thick core with high dust temperature about 100 K. The disk component dominates the infrared radiation in total, yet the surface density of the infrared luminosity is much higher in the core, which has the characteristic properties of an Eddington-limited starburst.
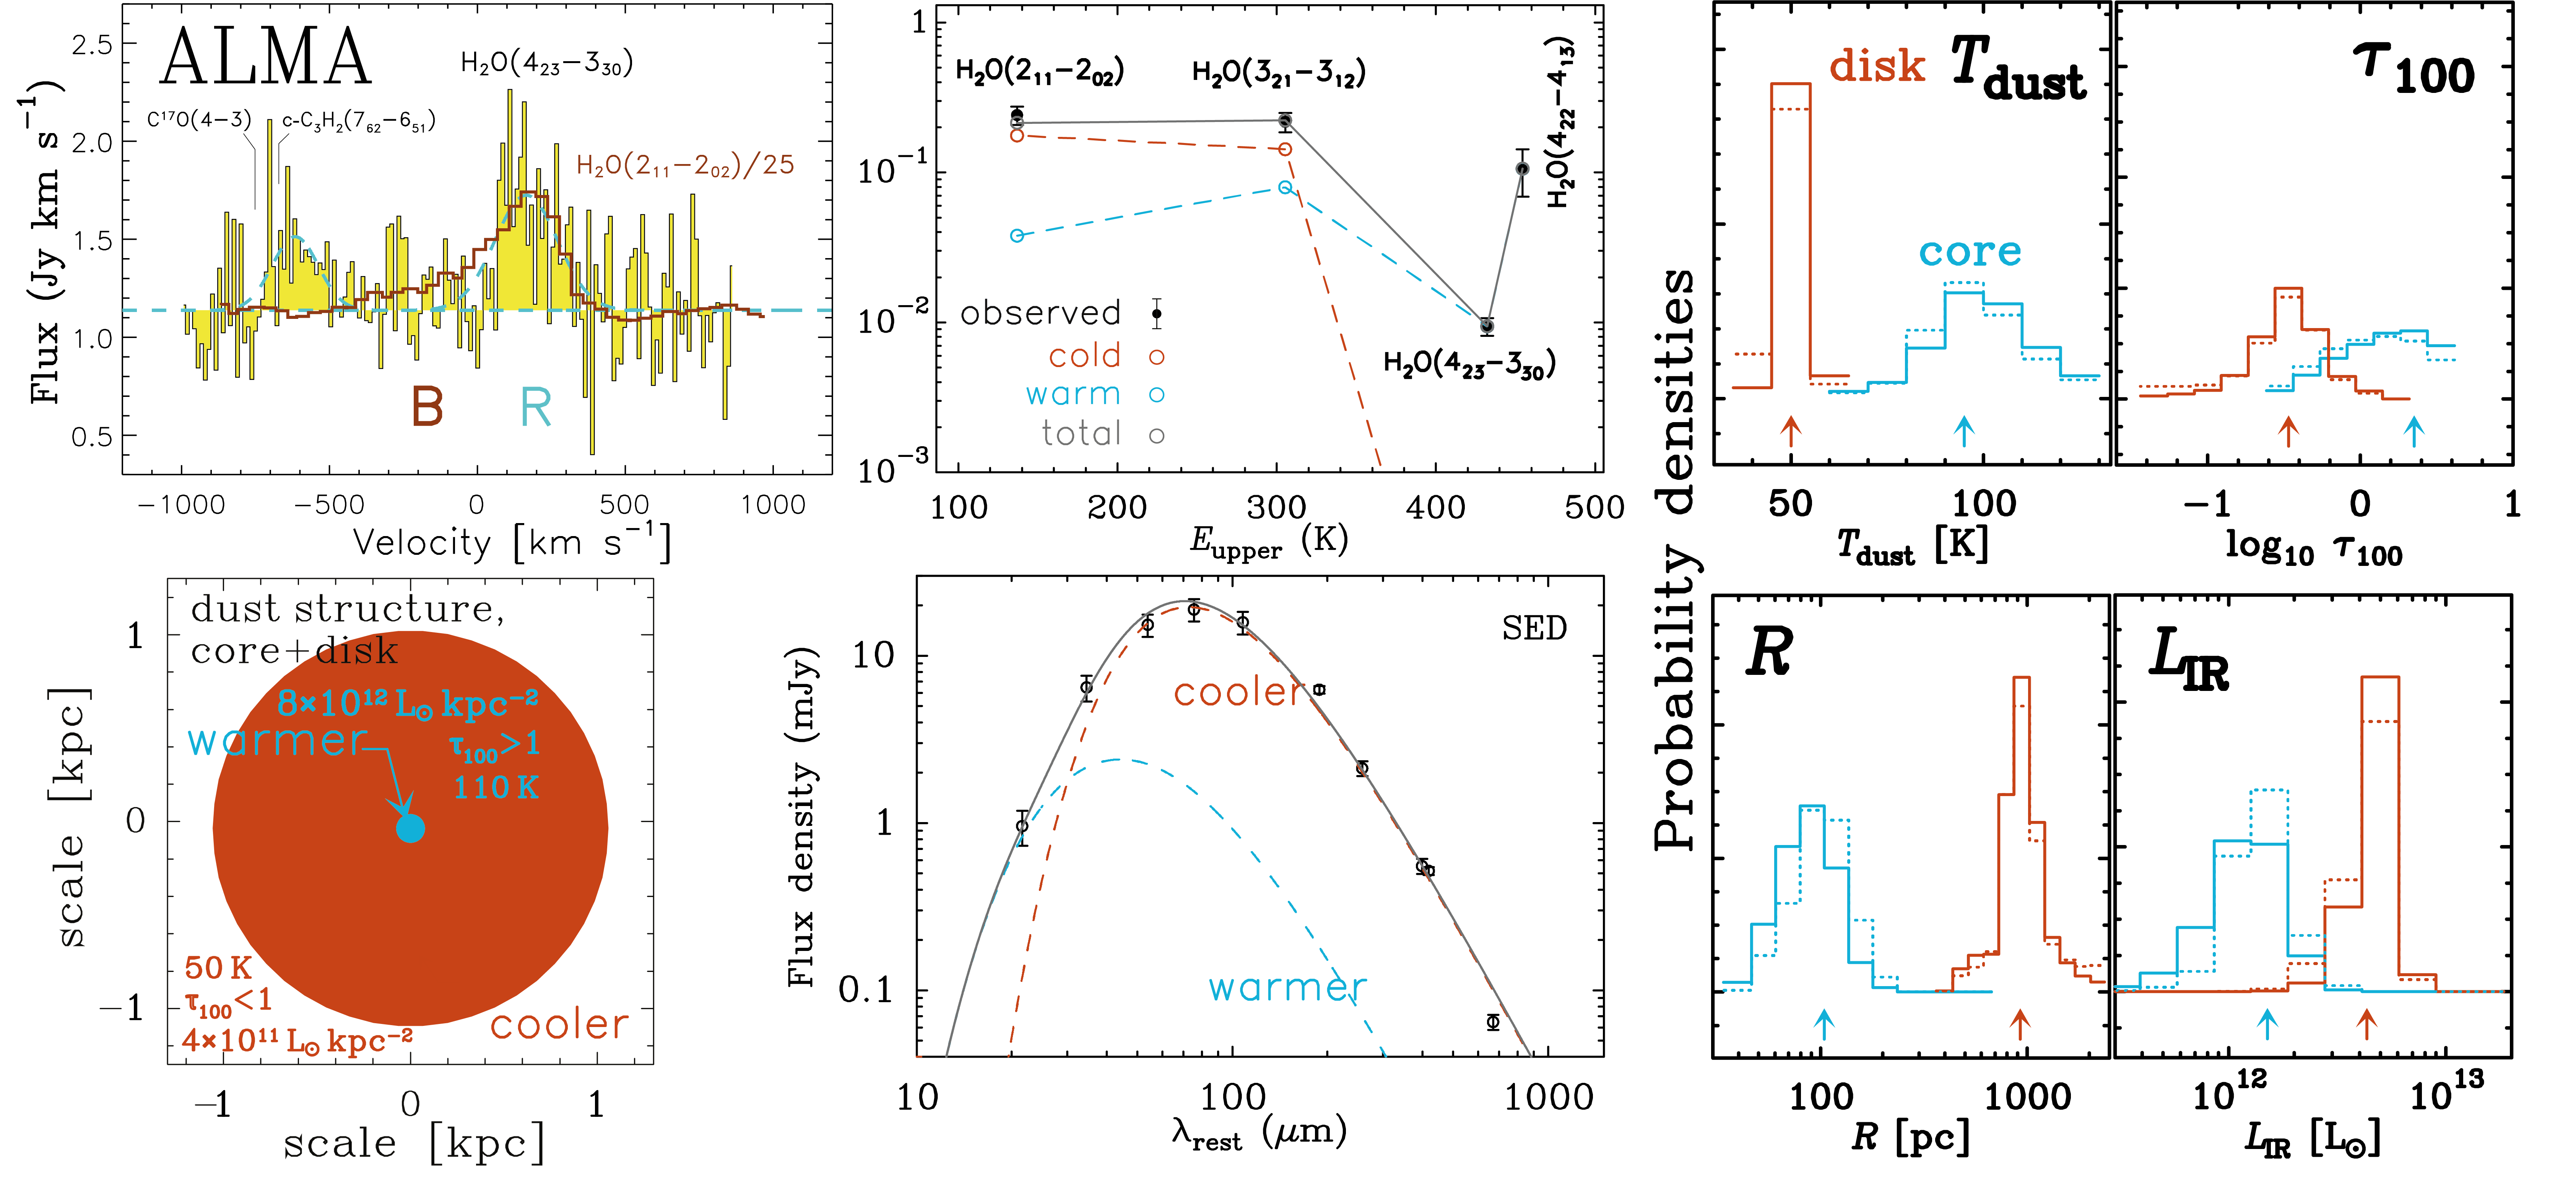
Figure adapted from Yang et al. (2020) show the observed spectrum, observed and modeled water SLED, and the results from modeling the excitation of the water lines. The model sketch is described in the bottom left panel, while the right panel shows the parameter distribution.
Molecular gas and CO excitation in high-redshift dusty galaxies
CO lines are very useful for us to understand the properties of the molecular gas. By observing multiple transitions of the CO lines, namely the CO SLED, we can infer the excitation conditions of the molecular gas, such as density and kinematic temperature. Here, we conducted a large-sample study of CO SLEDs in 16 high-redshift () strongly lensed dusty star-forming galaxies (Yang et al. 2017).
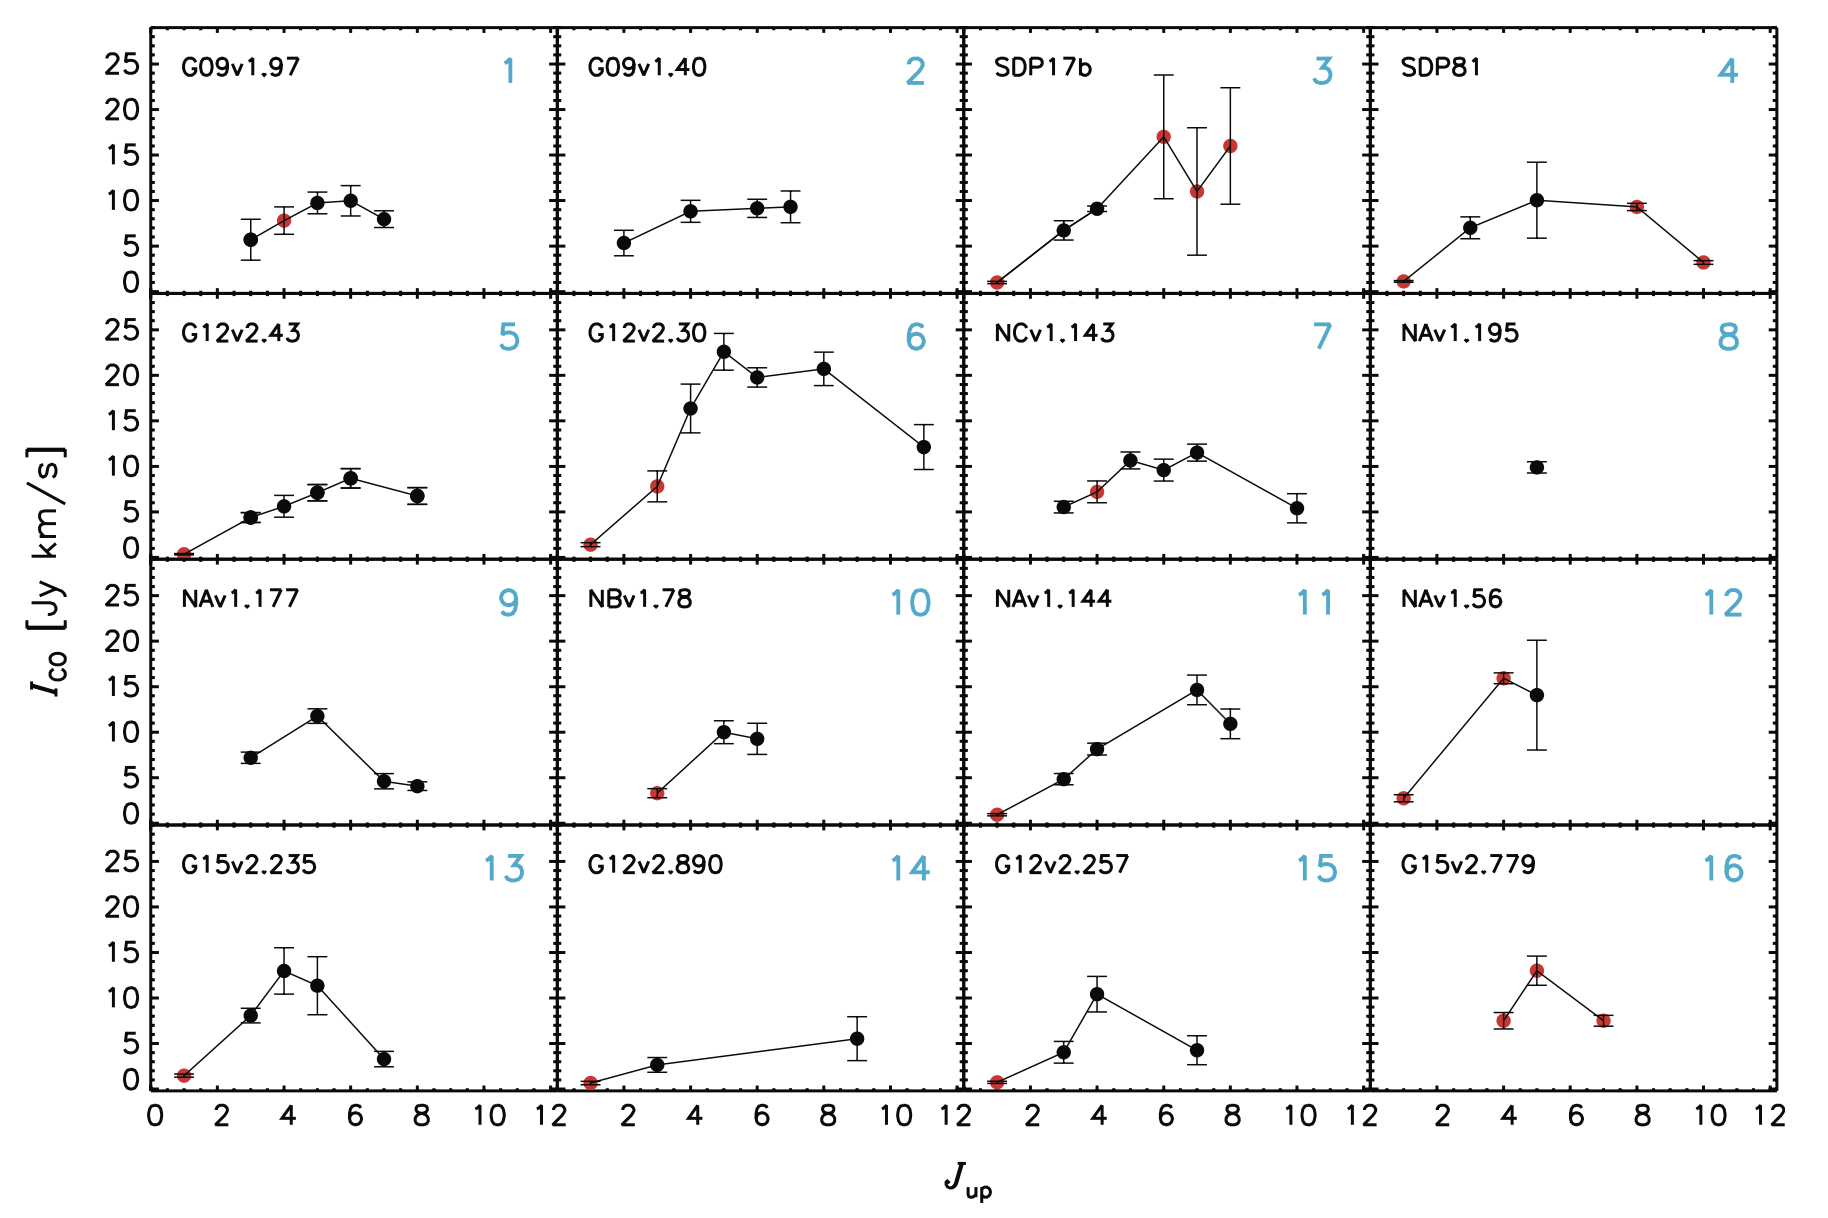
Figure adapted from Yang et al. (2017). The figure shows the distribution of the observed velocity-integrated CO line flux density versus the rotational quantum number Jup for each transition, i.e., CO SLEDs. Black dots with error bars are the velocity-integrated flux densities from this work. The red dots are the data from other works.
Having a look at the averaged CO SLED, we discovered that the CO excitation of the high-redshift dusty star-forming galaxies (or submillimeter galaxies) contain at least two components: a low excitation component whose SLED is peaking around and a high excitation component peaking around . This is similar to local ultra-luminous infrared galaxies (ULIRGs) such as Arp 220. However, for the normal star-forming galaxies, the low excitation dominates the overall SLED, which is different from ULIRGs and high-redshift dusty star-forming galaxies.
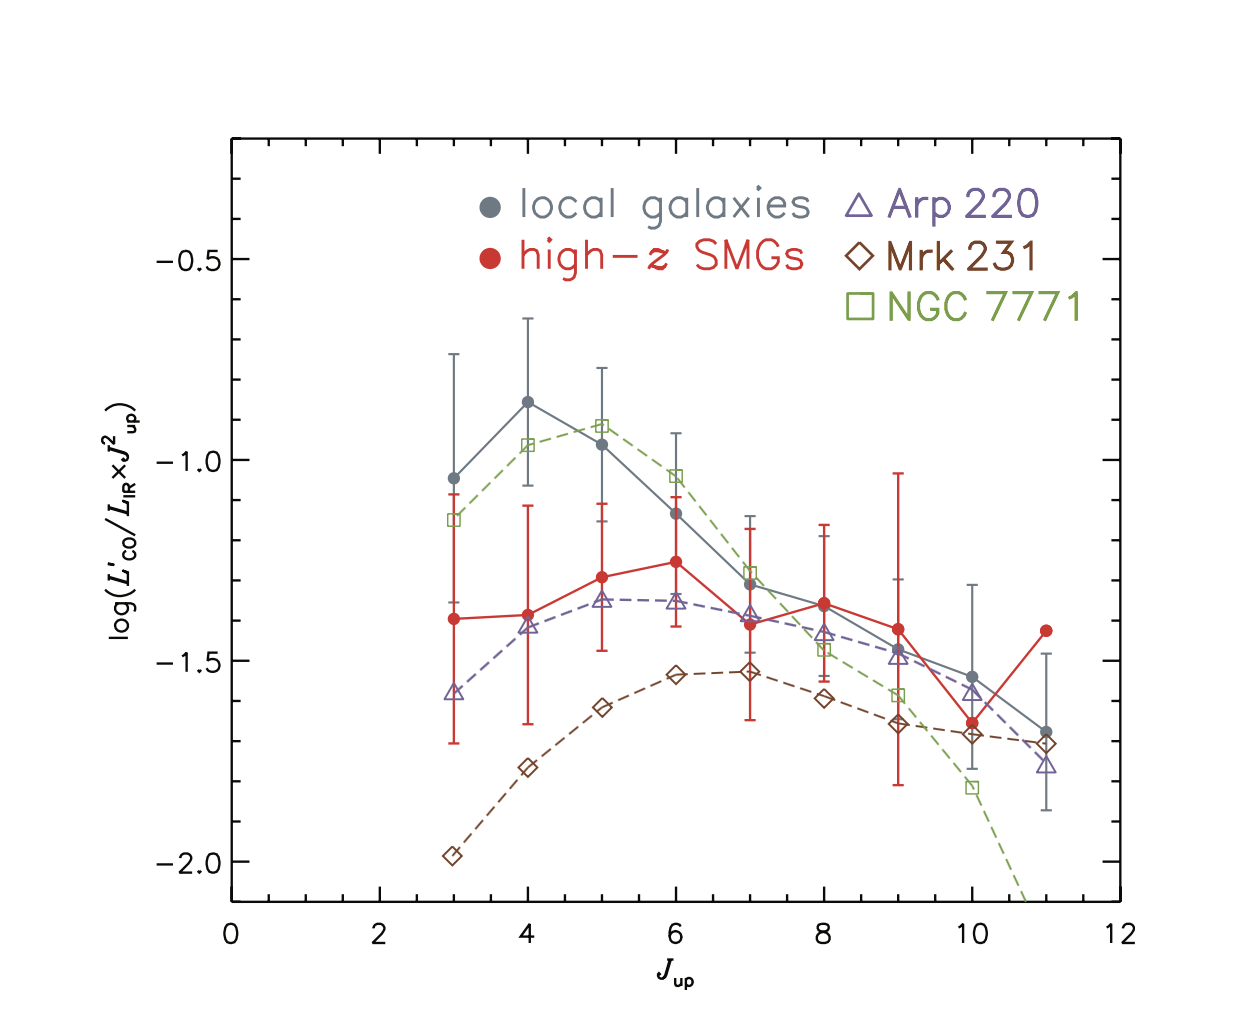
Figure adapted from Yang et al. (2017). The figure shows the CO SLEDs of local galaxies and high-redshift SMGs normalized by total infrared luminosity. Grey symbols indicate the Gaussian mean of local infrared bright galaxies (without ULIRGs). We also include a typical local ULIRG, Arp 220 (purple dashed line and open triangles), an AGN-dominated source, Mrk 231 (red dashed line and open diamond), and a LIRG, NGC7771 (green dashed line and open square). Red symbols show high-redshift SMGs. It is clear that the CO SLED decreases with increasing Jup for local galaxies while it remains flat for high-redshift SMGs and typical starburst-dominated ULIRGs, such as Arp 220.
To model the CO excitation, we have applied the LVG modeling with the RADEX code, with an MCMC approach with the emcee package (see our RADEX+emcee code here). The advantage of directly combining RADEX with emcee compared to the grid approach is that the parameter space will be explored more thoroughly.
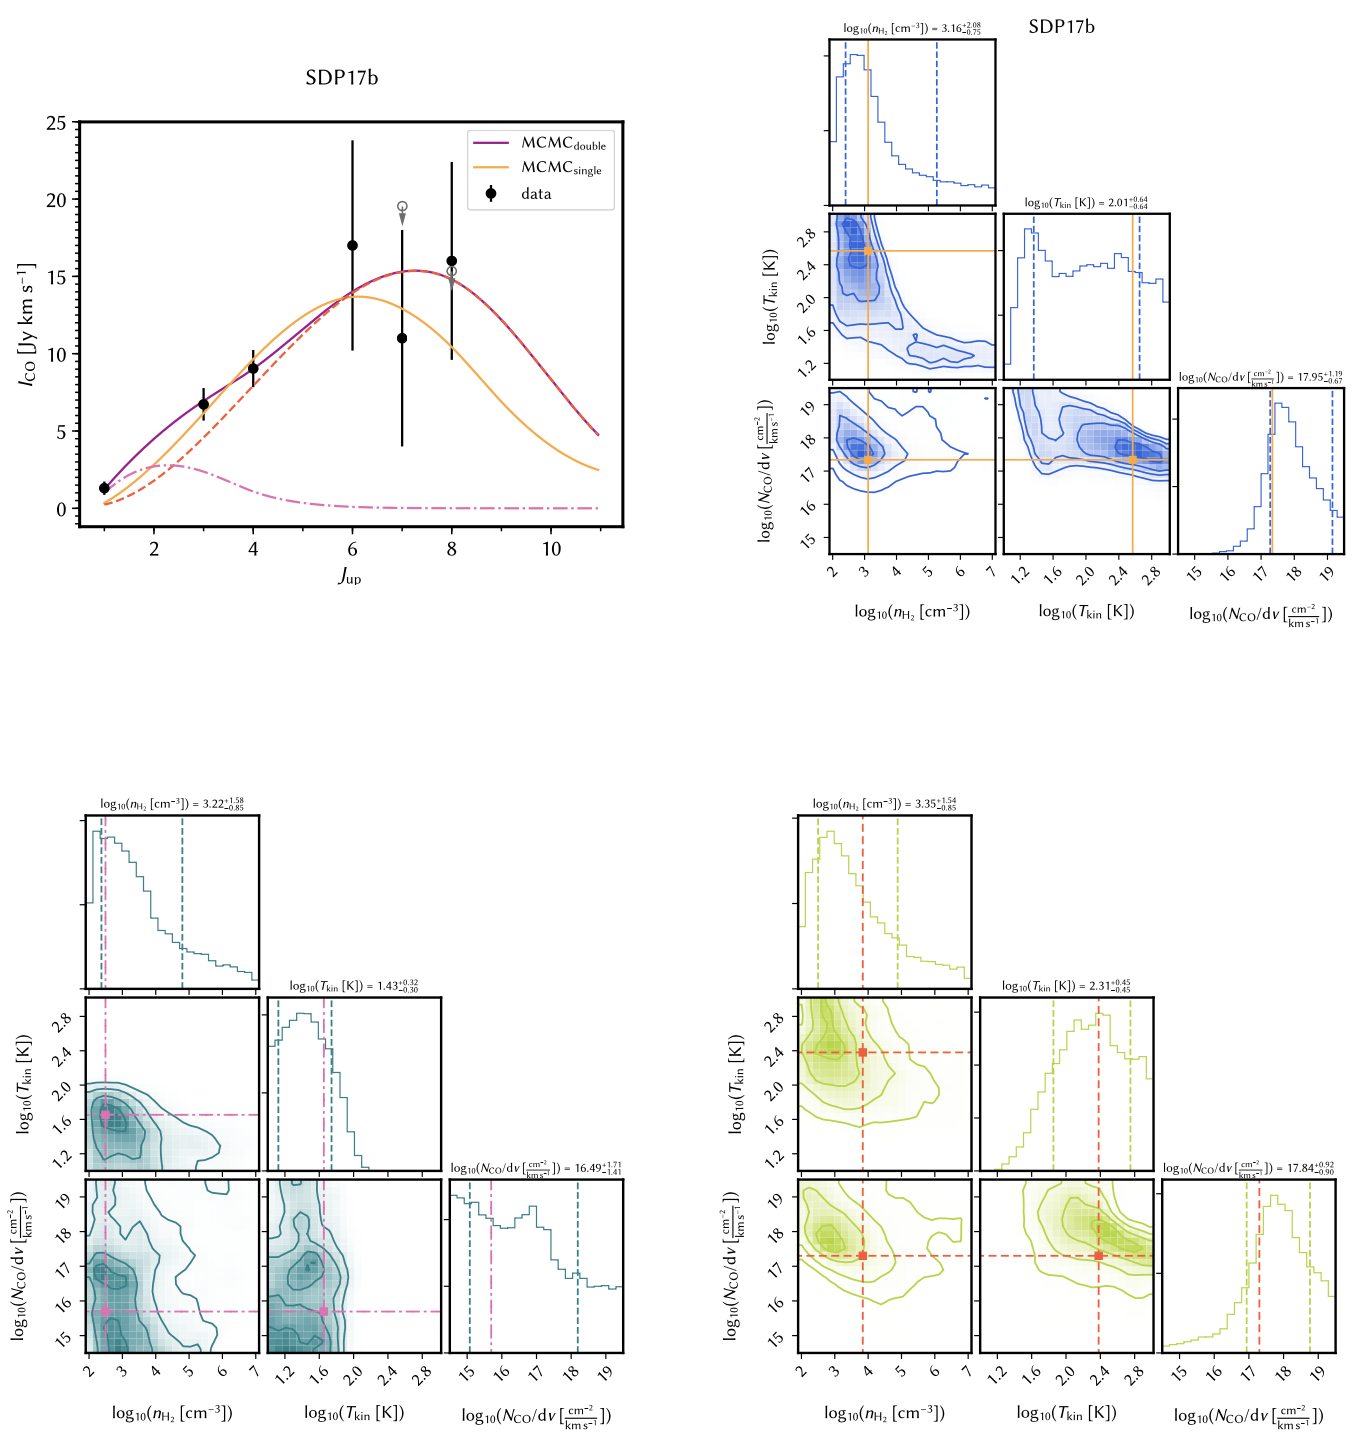
Figure adapted from Yang et al. (2017). The figure shows the LVG modeling results. Upper left panel: The CO SLED of each source is plotted in black. The solid orange curve shows the best fit from the single-component model corresponding to the maximum posterior possibility, while the solid purple line shows the best fit of the two-component model. The dashed red line shows the warmer component, and the dashed-dotted line shows the cooler component fit. The upper limits are shown in grey open circles with downward arrows. Upper right panel: The posterior probability distributions of molecular gas density, kinematic temperature, and CO column density per velocity of the source, with the maximum posterior possibility point in the parameter space shown in orange lines and points. The contours are in 0.5-σ steps starting from the center. Lower panels: The posterior probability distributions for nH2, Tkin, and NCO/dv of the cooler (dark green) and warmer (light green) component of the two-component model.
Analyzing the extracted physical conditions, we find a tight correlation between the gas pressure and the star formation efficiency after including some nearby galaxies. This suggests that the thermal pressure of the bulk of molecular gas plays an important role in regulating the star formation at galactic scales across a range of redshifts.
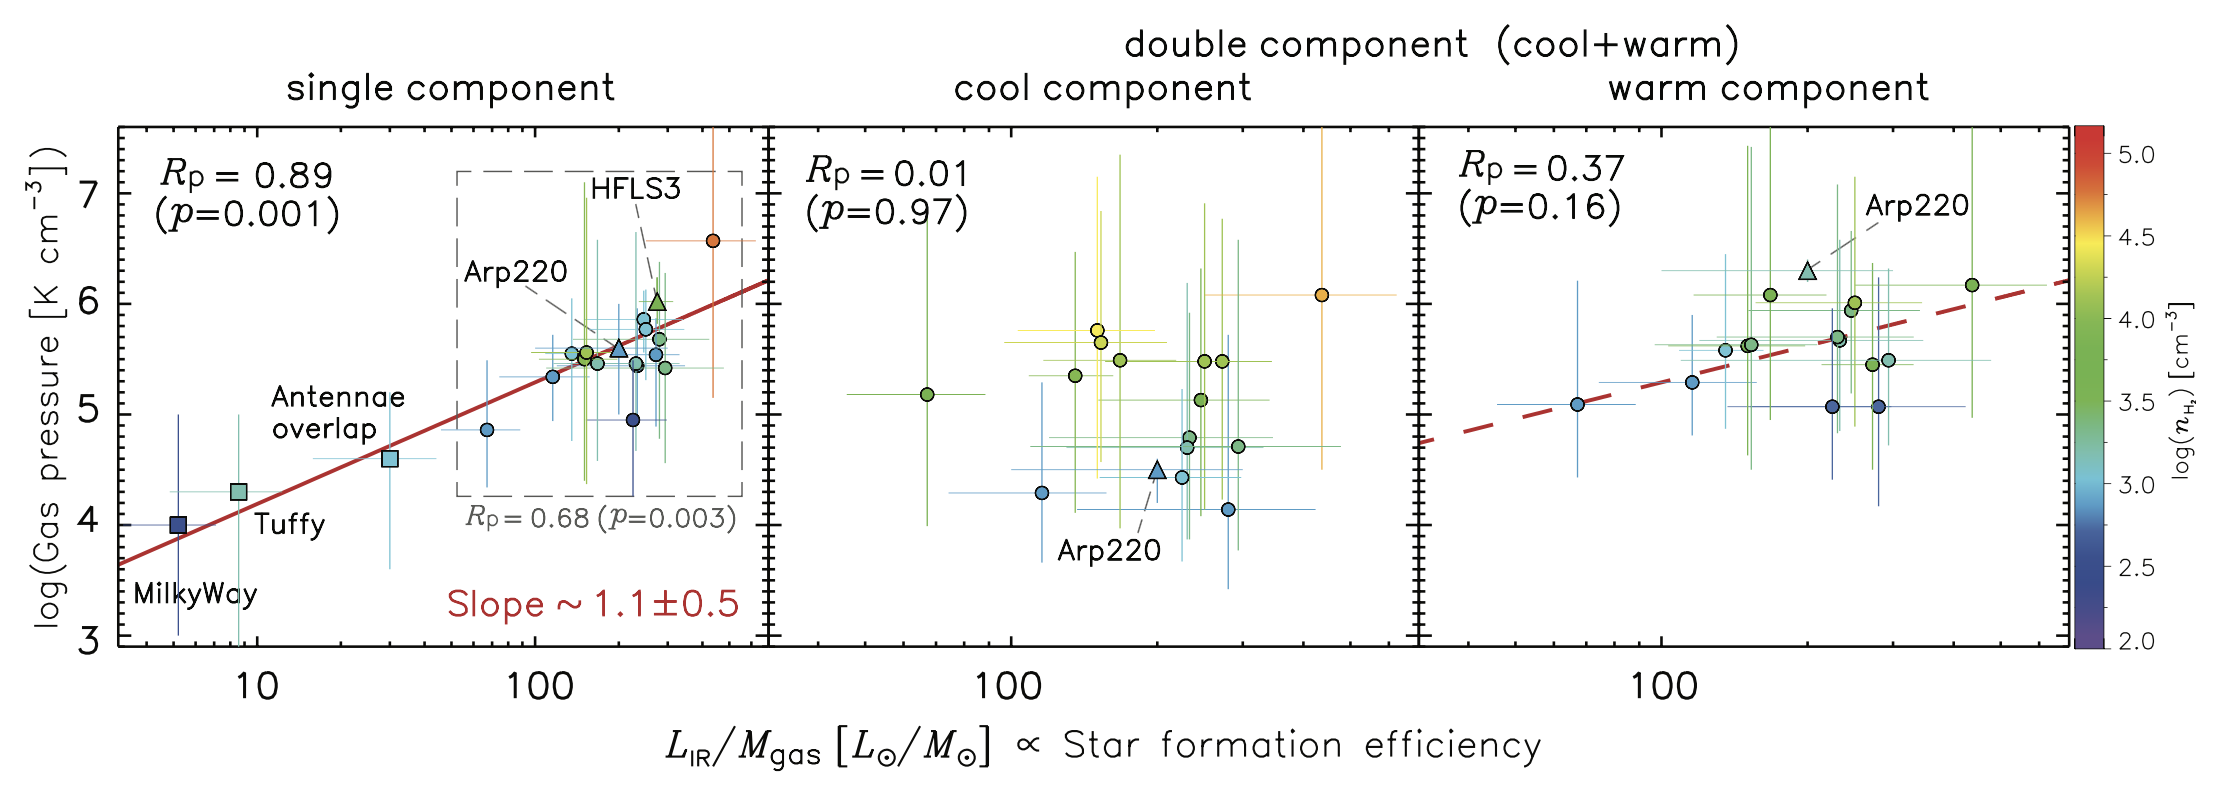
Figure adapted from Yang et al. (2017). Left: Thermal gas pressure plotted against star formation efficiency. Filled circles are the H-ATLAS SMGs. The color is coded based on their values of molecular gas density. The red line shows the fit to the correlation, which yields a slope of 1.1±0.5 for all the sources. Middle: Similar correlation plot as in the left panel but only for the cool component from the two-component LVG modeling. There is no correlation found. Right: Similar correlation plot as in the left panel but only for the warm component in the two-component LVG modeling. The dashed red line is an overlay of exactly the same red line plotted in the left panel. The data points follow the same correlation found in the single-component fit. In all three panels, the legends show Pearson’s correlation coefficient RP with the corresponding p-value. The values of nH2 for each point are indicated by the color bar.
You may also be interested to read more from my talk presentation at the conference "The Laws of Star Formation: From the Cosmic Dawn to the Present Universe," @Cambridge University (UK, 2018).
Exploring the Hidden Dusty Nuclei of Galaxies (HIDDeN)
I am currently part of the HIDDeN (PI: Prof. Susanne Aalto), studying the < 10 pc scale structures and kinematics of the most dusty-obscured galactic nuclei across cosmic time, with ALMA observations of unique tracers of dense gas like HCN, HCO, HCN-VIB, CH3OH, HCN, HNC, CHNH.